
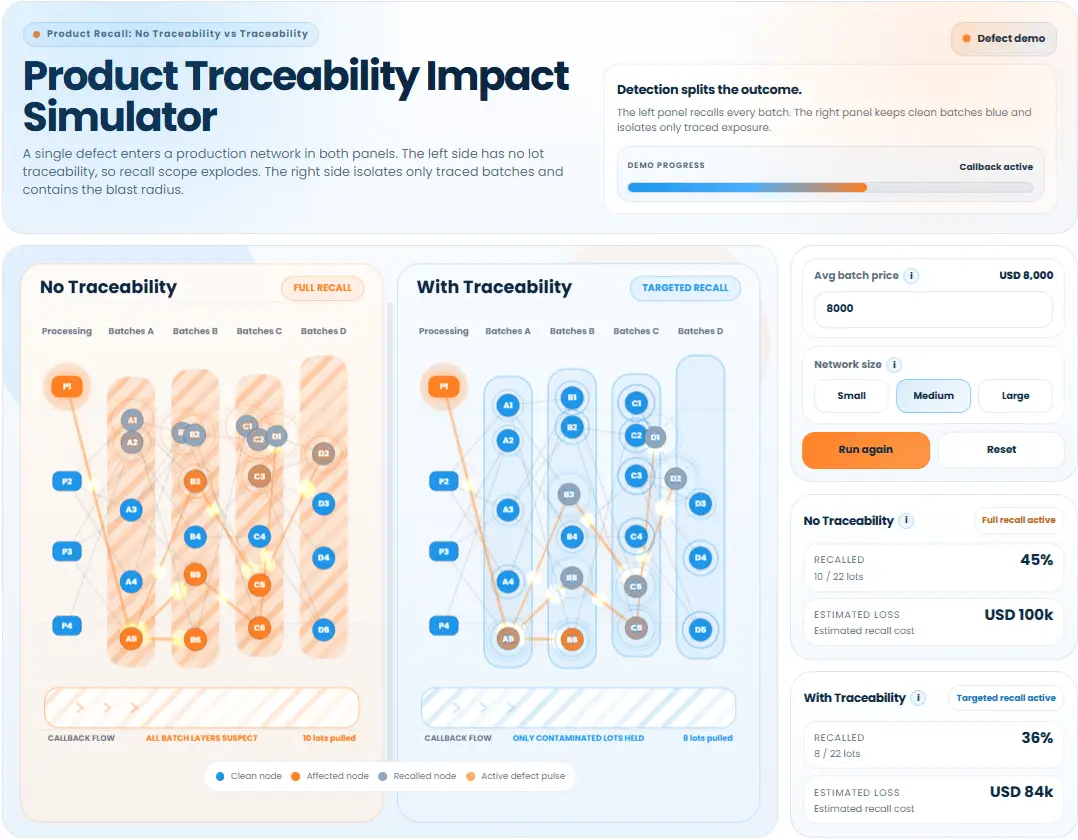
Product Recall — No Traceability vs Traceability
A single defect enters a production network in both panels. The left side has no lot traceability, so recall scope explodes. The right side isolates only traced batches and contains the blast radius.
Show how things actually work, not just what the outcome is, even when the structure has multiple moving parts.
Compare strategies, policies, or configurations in a controlled environment before making the real-world move.
Turn assumptions into something visible and testable so decisions are backed by modeled behavior instead of opinion alone.
Give everyone the same model to reason about so teams can discuss trade-offs on shared ground.
Produce realistic datasets and compare outcomes across scenarios, even when real data is missing, incomplete, or too sensitive to use directly.
Customize stages, flows, dependencies, network structure, spatial layouts, and agent interactions.
Tune demand, capacity, budget, policy, behavior rules, and external factors to match the real decision context.
Define visual simulation outputs, scenario comparisons, performance metrics, and exportable datasets such as CSV, time-series results, and scenario runs.
Tailor terminology, interface layout, branding, and presentation so the simulation feels native to your context.
A single defect enters a production network in both panels. The left side has no lot traceability, so recall scope explodes. The right side isolates only traced batches and contains the blast radius.
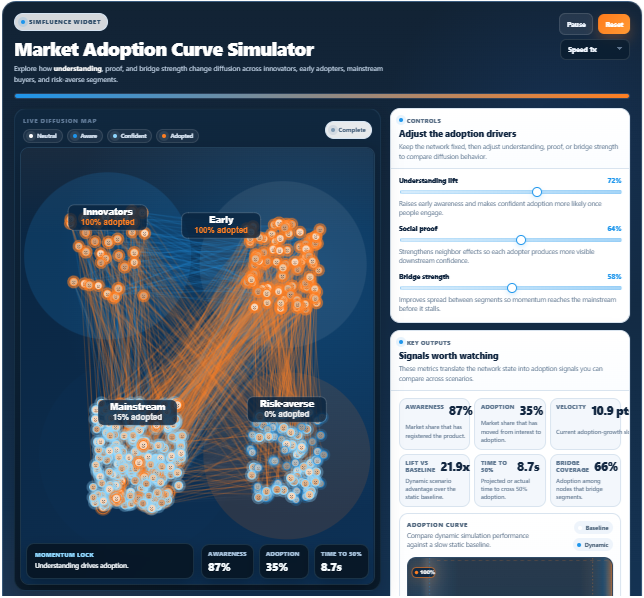
Product adoption curve simulator that models how understanding, social proof, and bridge strength shape diffusion across innovators, early adopters, mainstream users, and risk-averse segments.
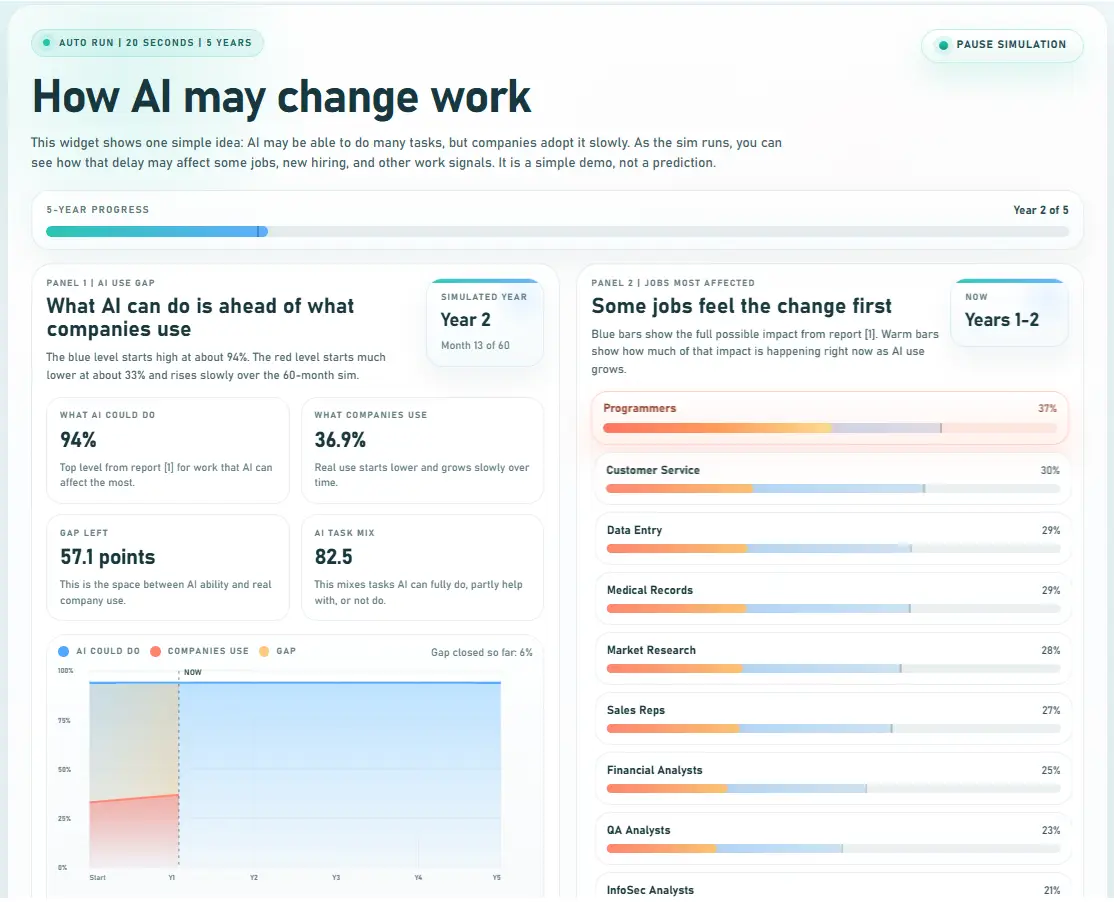
This widget shows one simple idea: AI may be able to do many tasks, but companies adopt it slowly. As the sim runs, you can see how that delay may affect some jobs, new hiring, and other work signals. It is a simple demo, not a prediction.