AI Customer Support Automation Simulation
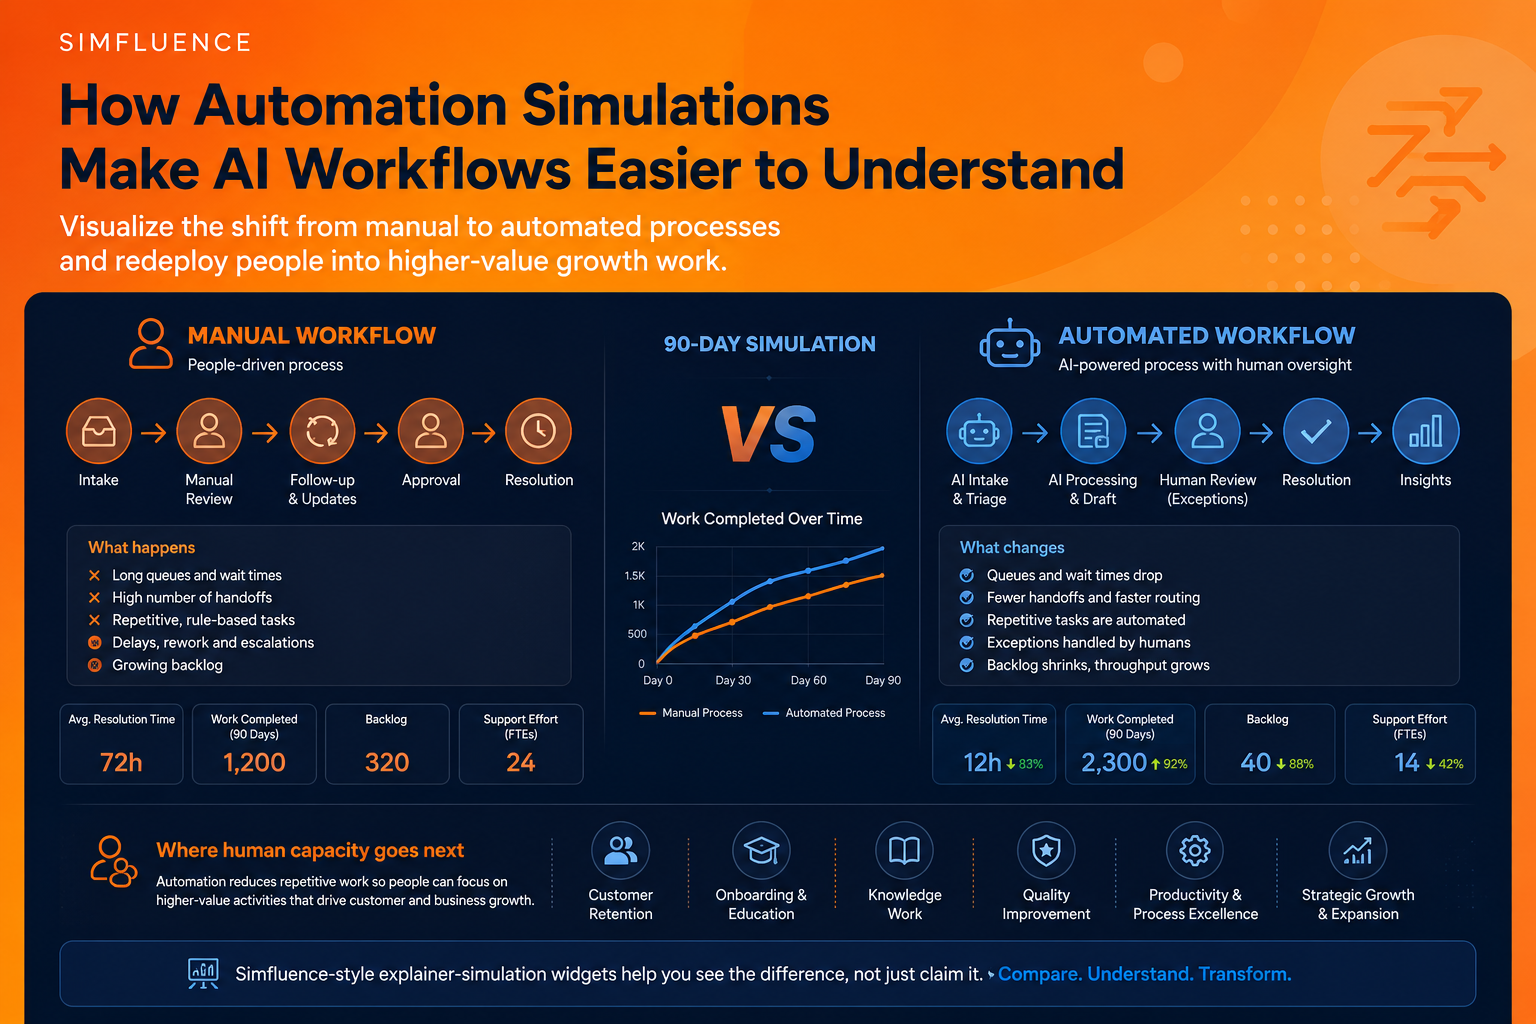
Compare an automated customer support operation with a manual service workflow. This 90-day simulation shows how AI-assisted support can reduce…
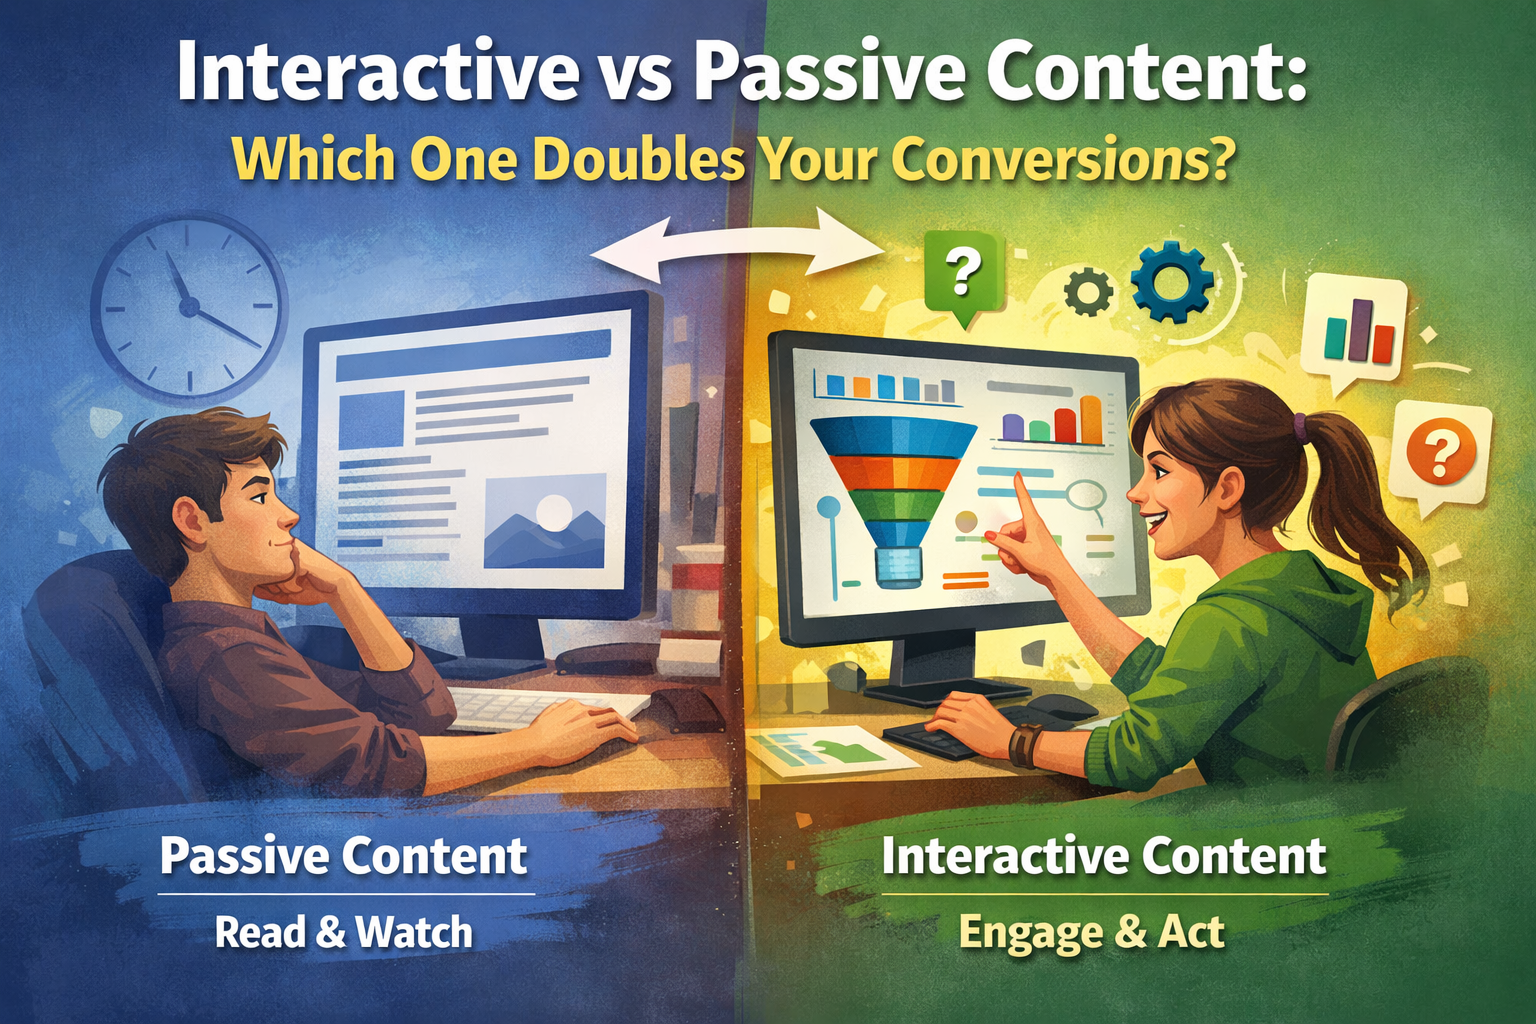
Make your business value, processes, and goals understood in 20 seconds. Turn static messages into clear, high-impact visual communication.
0% Clearer Message Understanding
0× More Active Engagement Time
0% Overall Message Effectiveness
Confirming the flow and measurable outcomes.
Adjusting assumptions and validating logic.
Shipping the files and making the simulation ready to use.
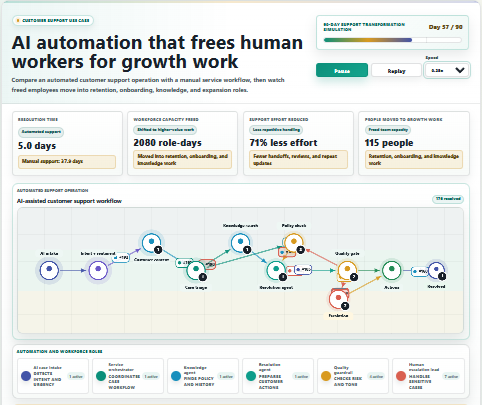
Compare an automated customer support operation with a manual service workflow. This 90-day simulation shows how AI-assisted support can reduce…
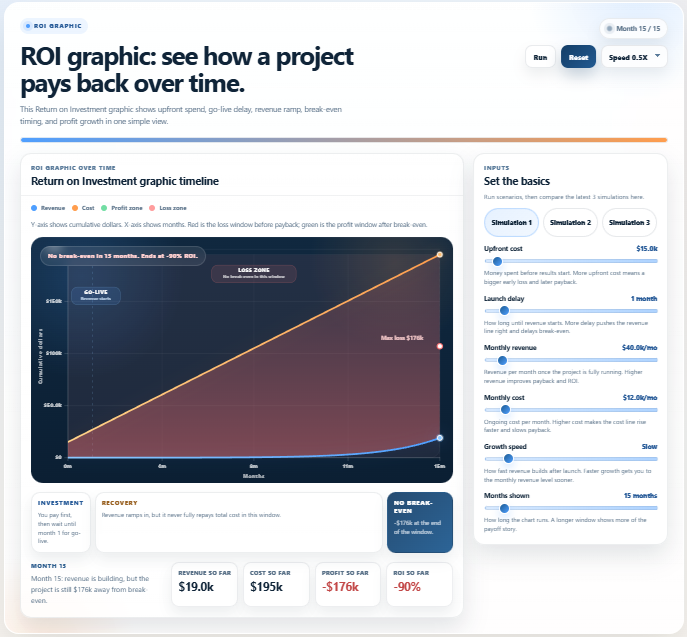
An interactive ROI calculator that shows how a project pays back over time. See upfront cost, launch delay, revenue growth,…
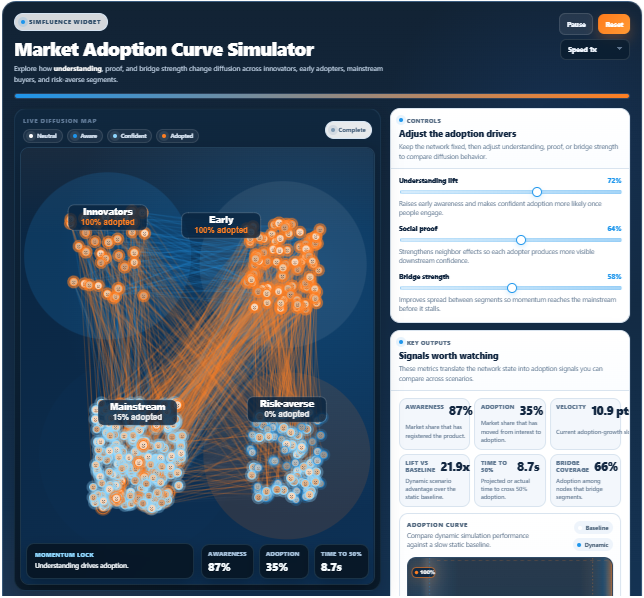
Product adoption curve simulator that models how understanding, social proof, and bridge strength shape diffusion across innovators, early adopters, mainstream…
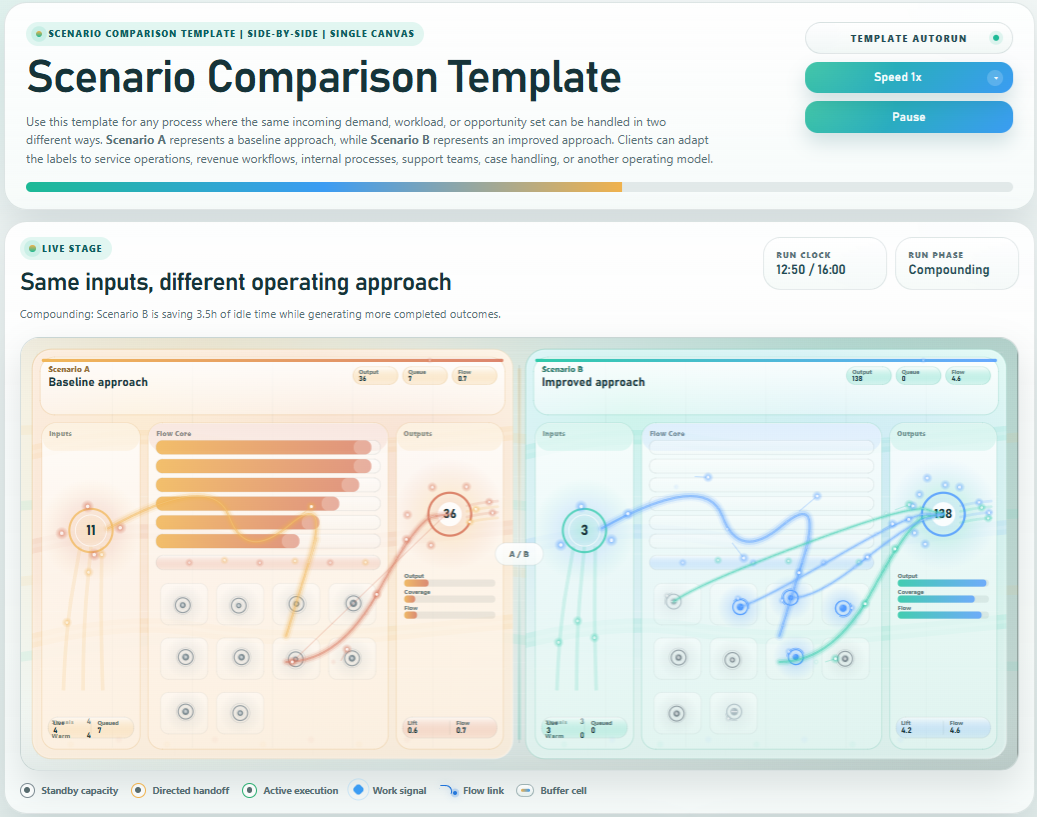
A reusable side-by-side simulation template that shows how the same inputs produce different results under a baseline versus improved operating…
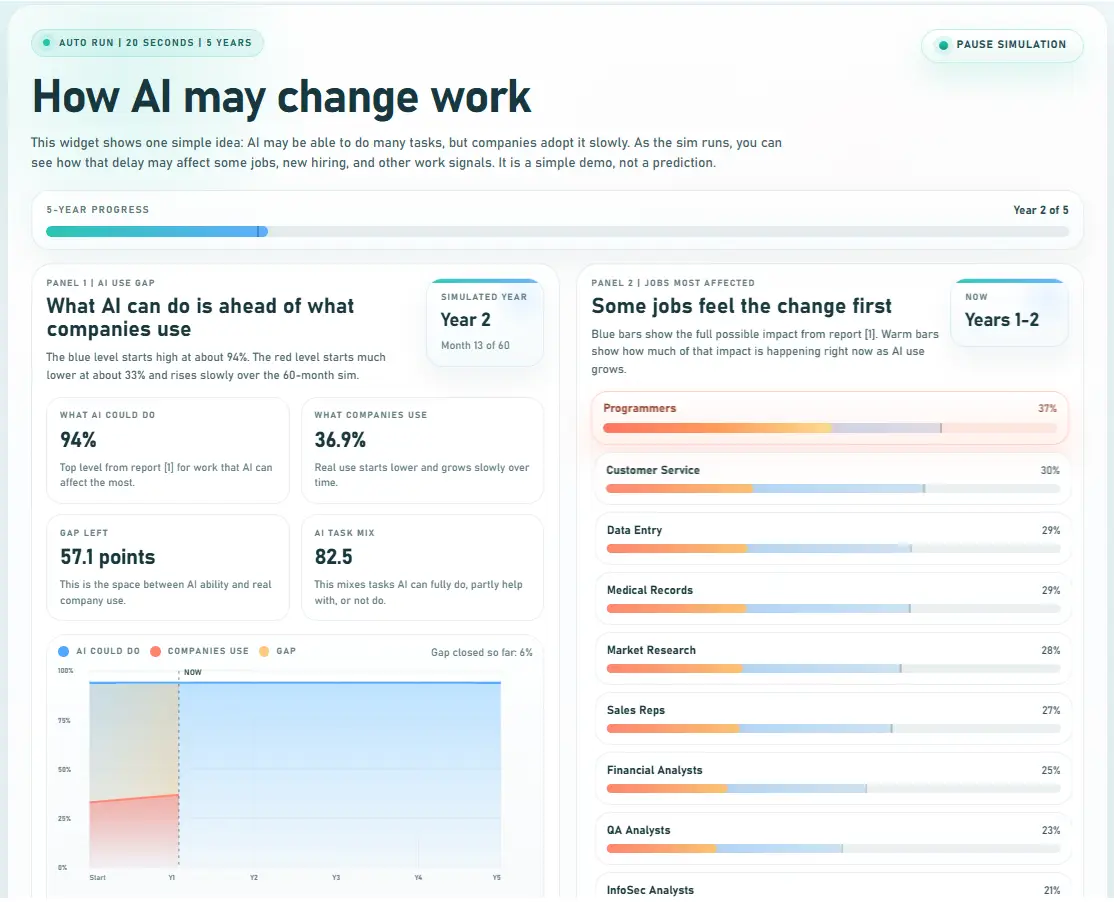
This widget shows one simple idea: AI may be able to do many tasks, but companies adopt it slowly. As…
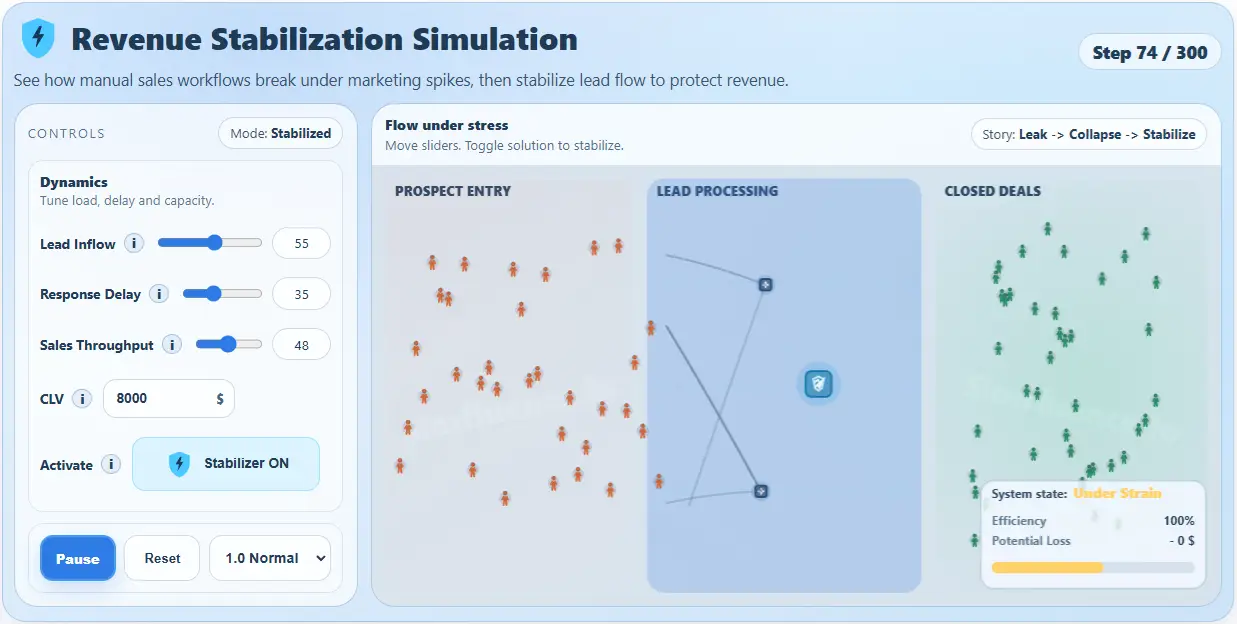
Make revenue leakage visible in under 20 seconds. This interactive widget shows how manual sales workflows collapse under inbound spikes…
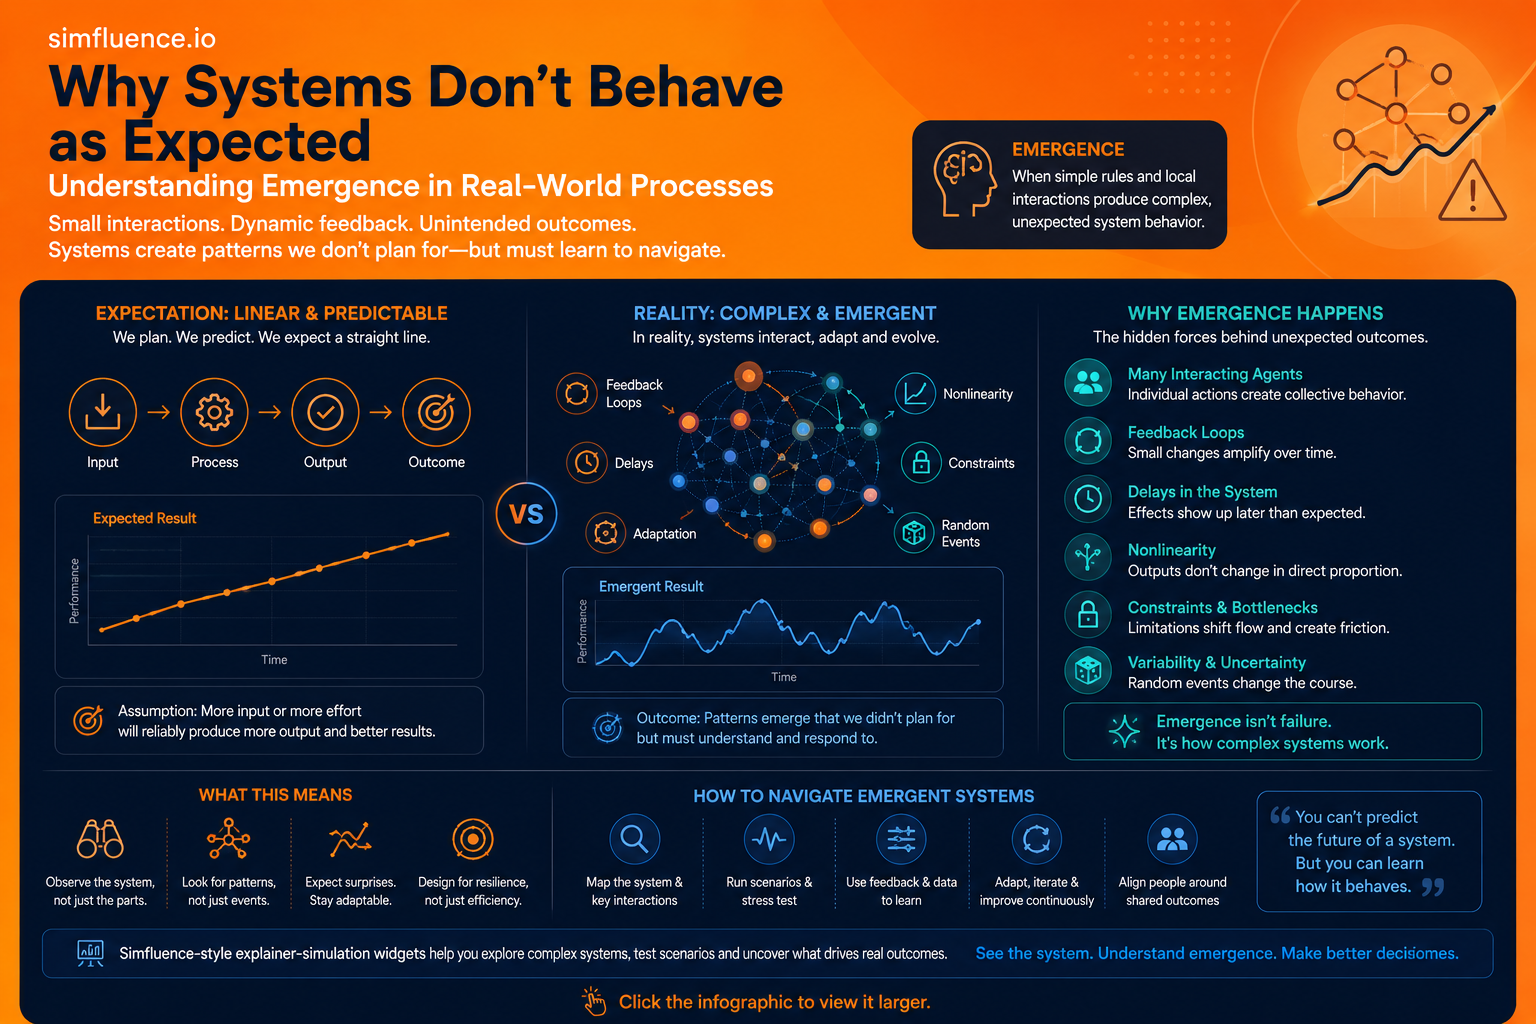
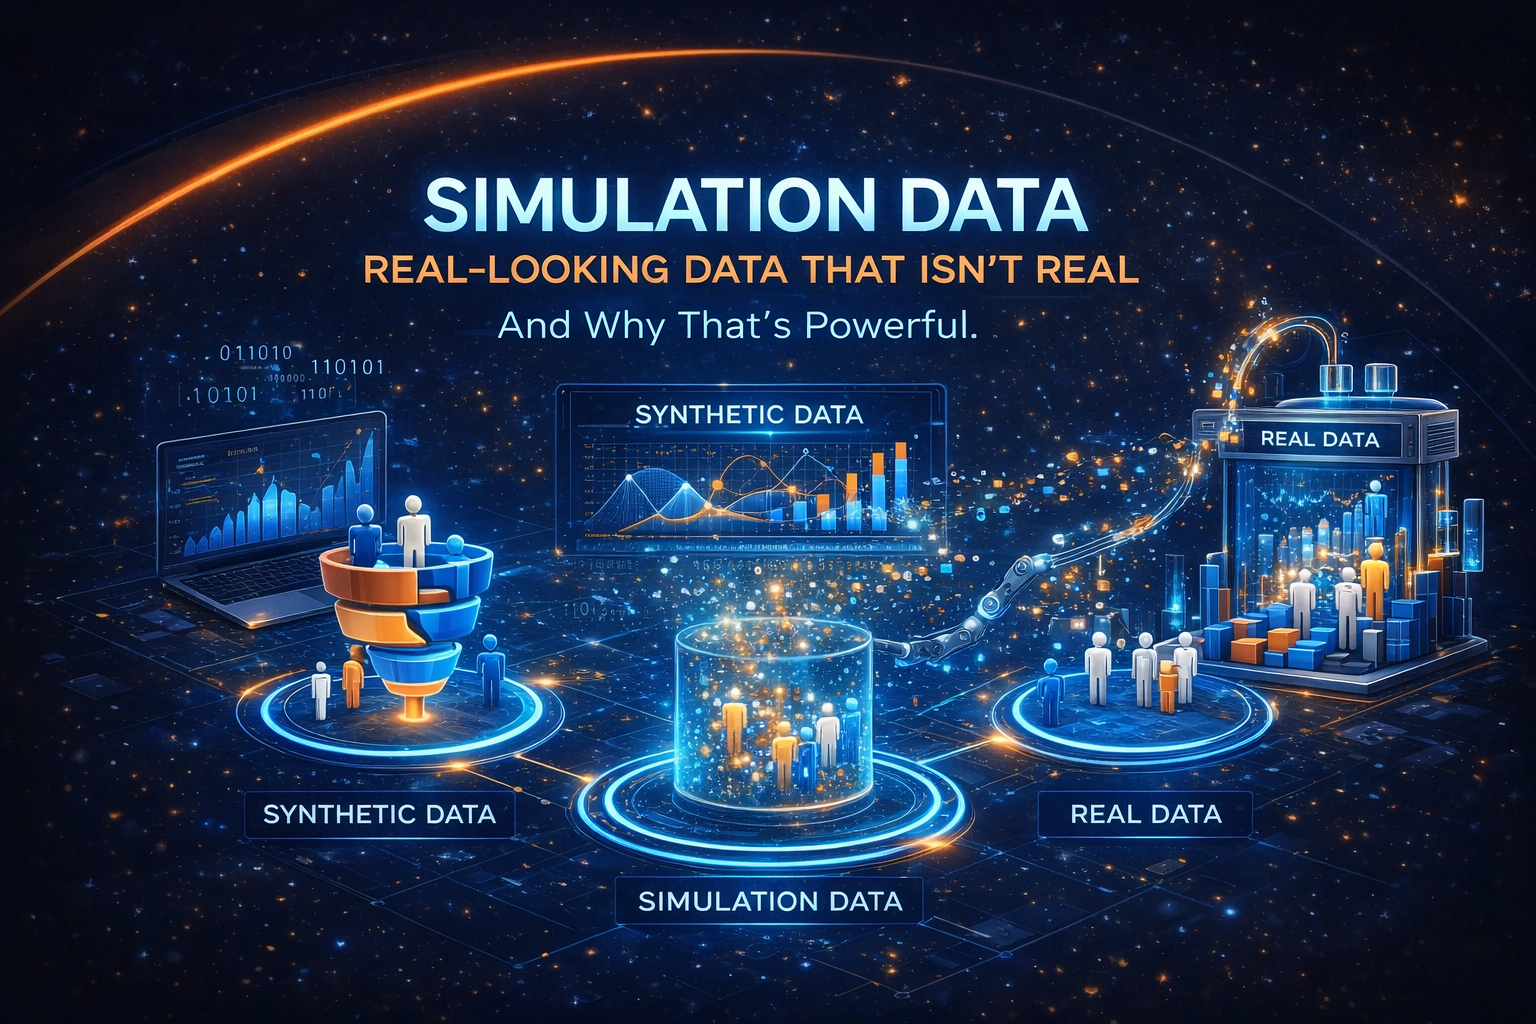
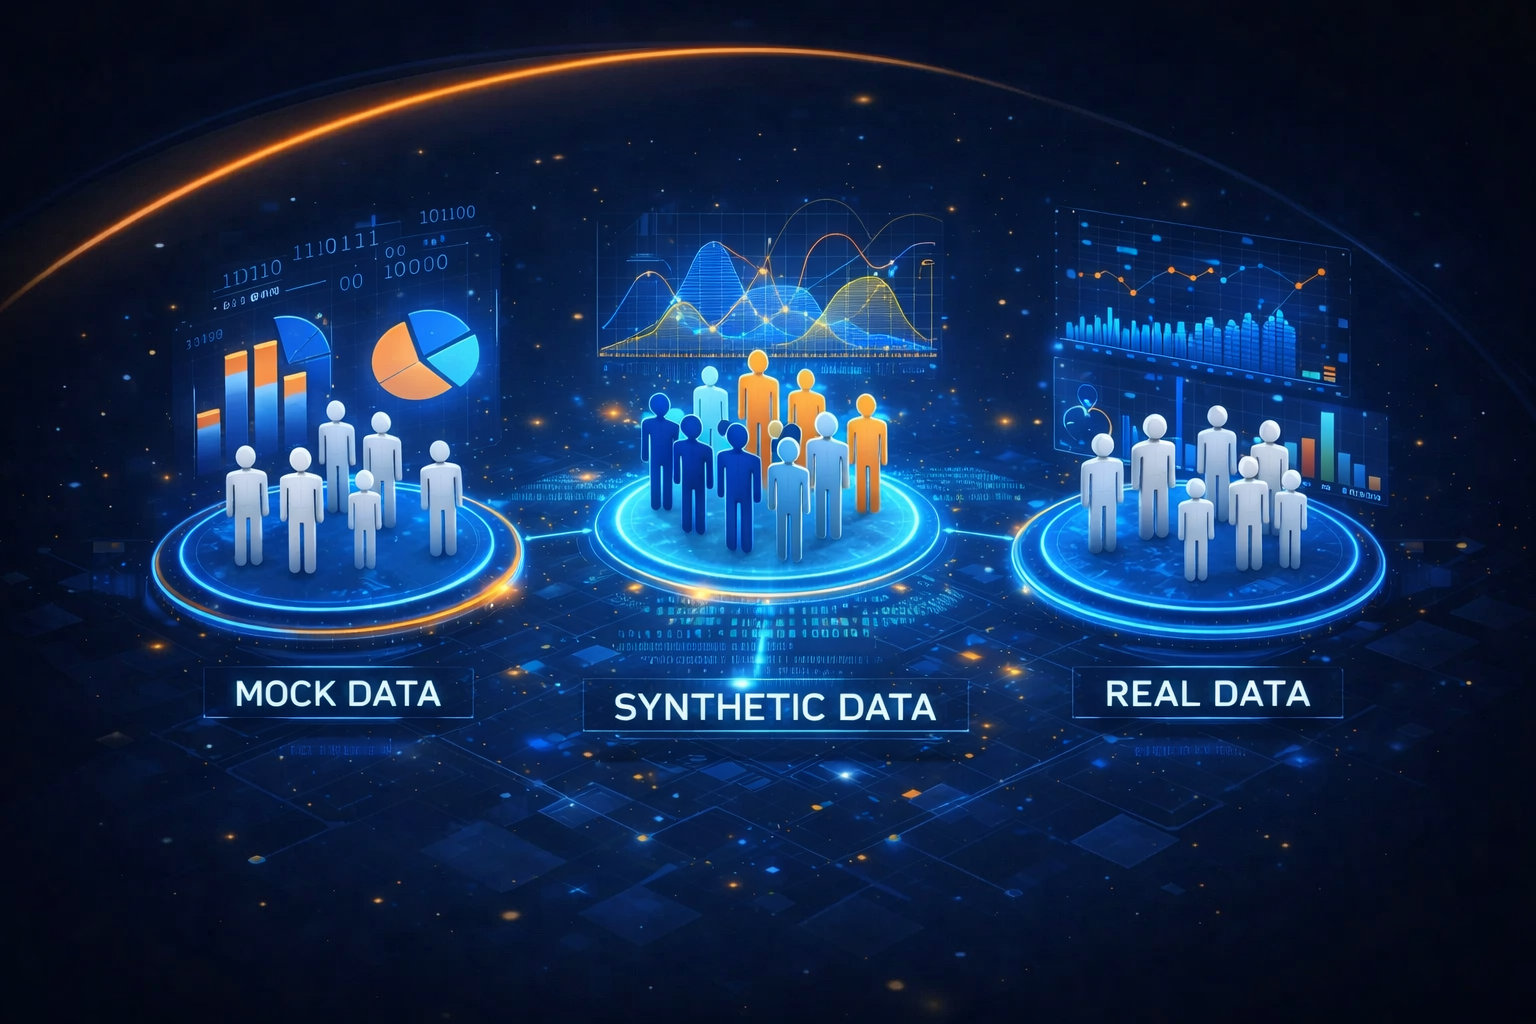
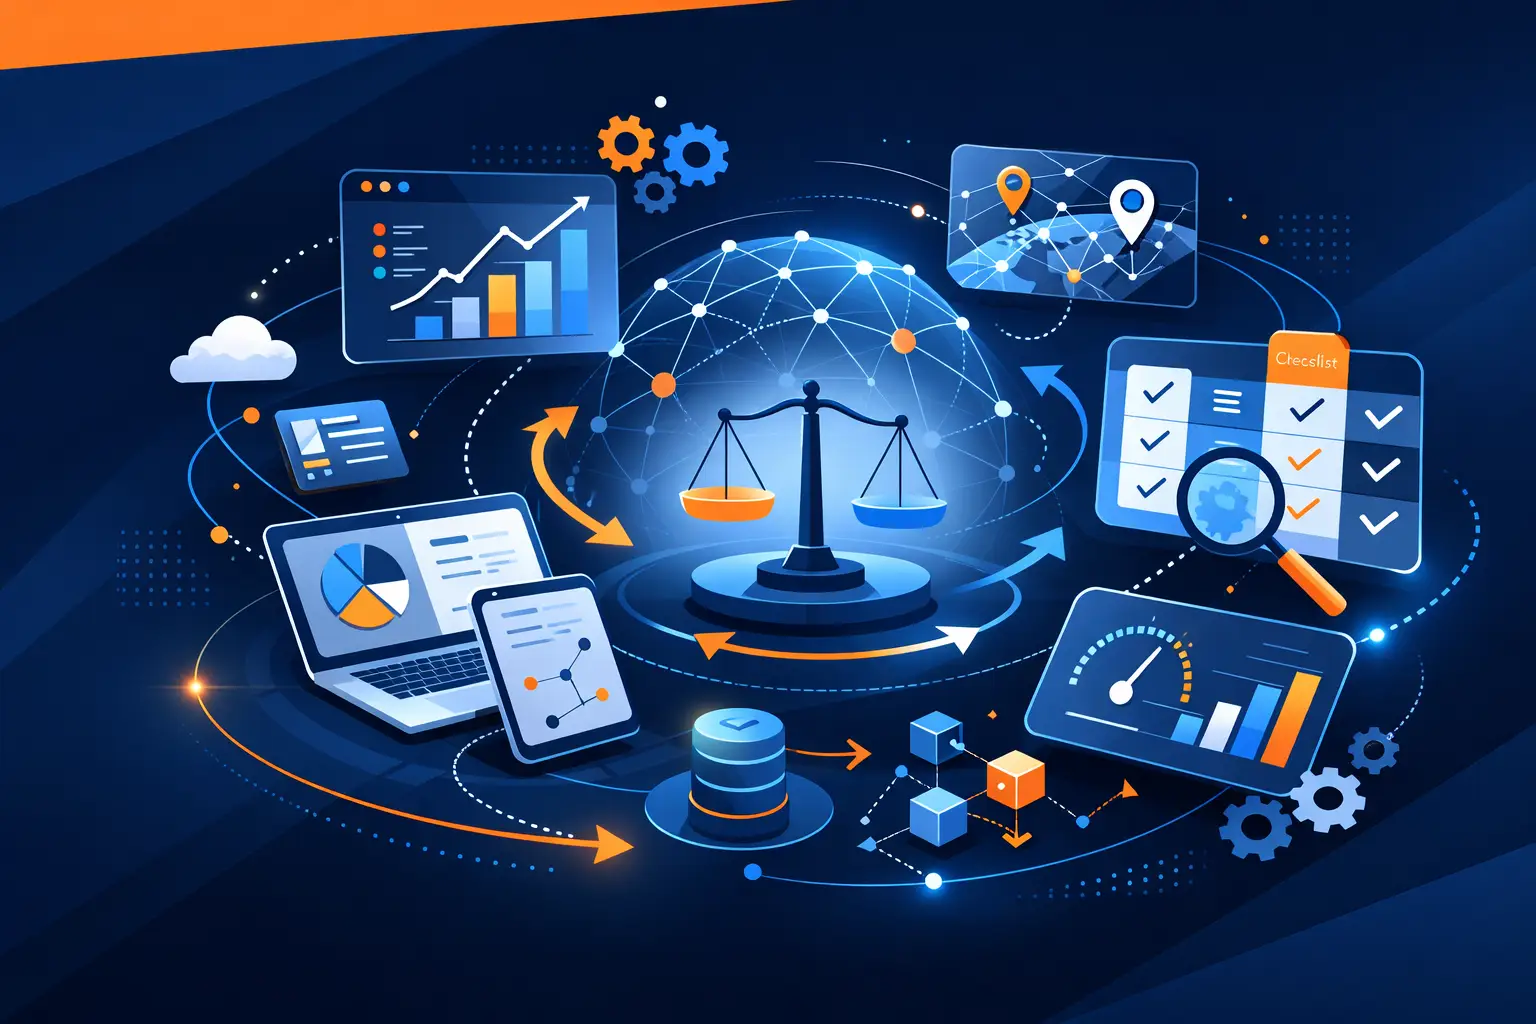
Simfluence draws on computational social science (CSS) — a field that studies society, organizations, and behavior as complex systems that can be modeled, explored, and tested.
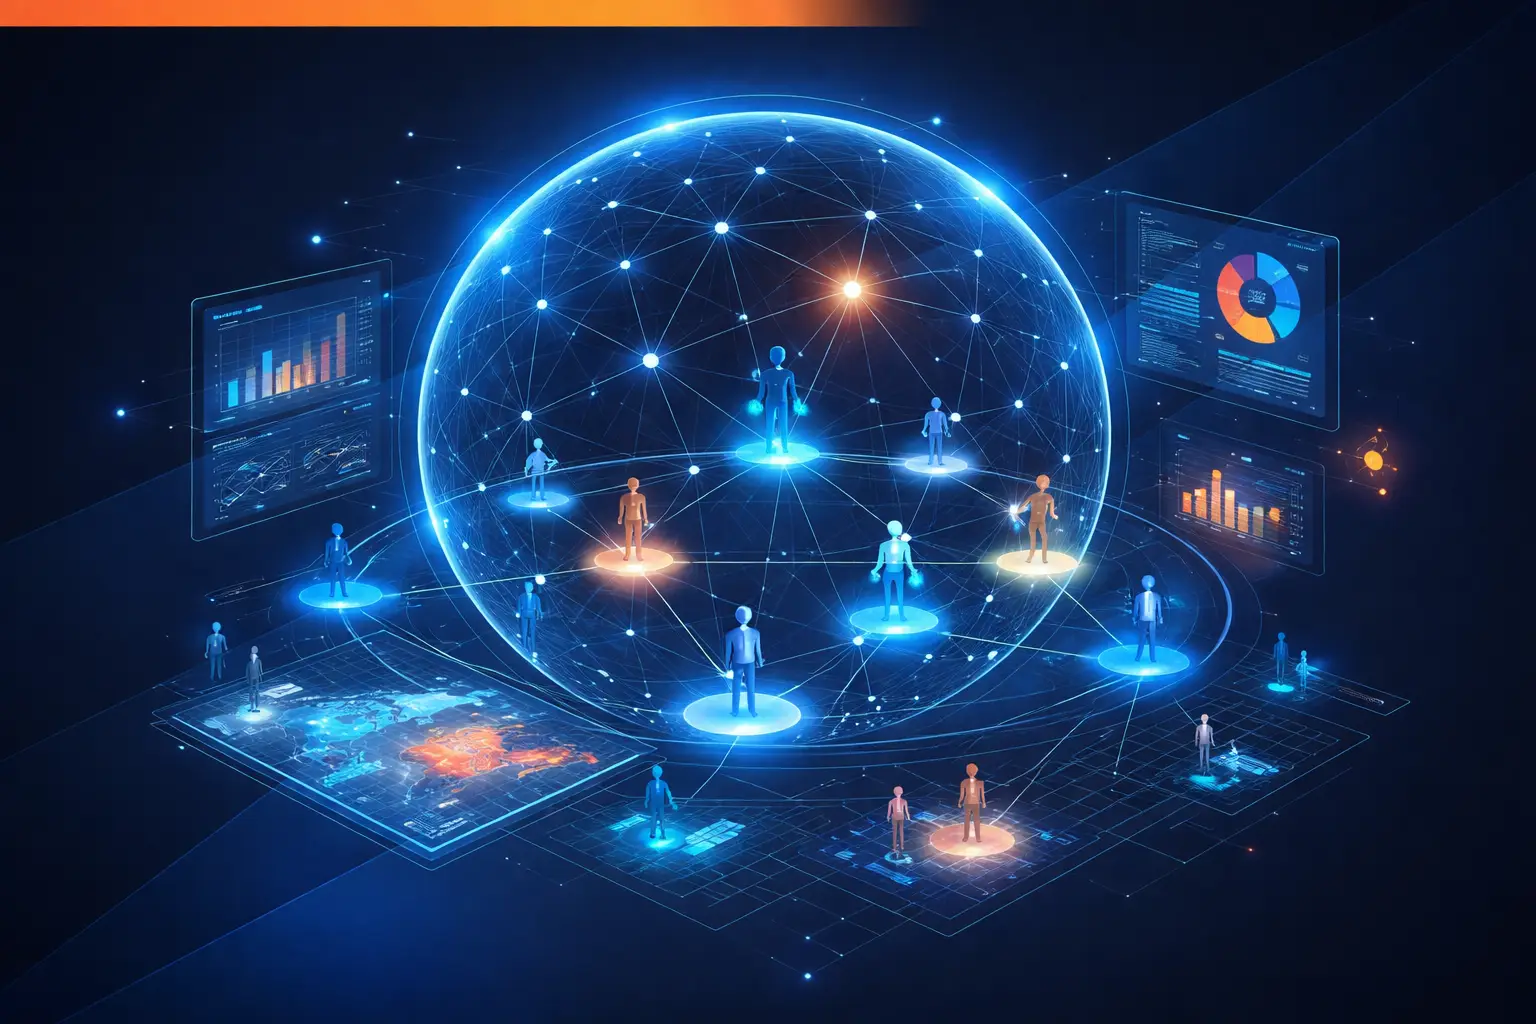
In CSS, you build a small world with rules: incentives, attention, trust, queues, thresholds, delays. Large patterns then emerge from many small interactions.
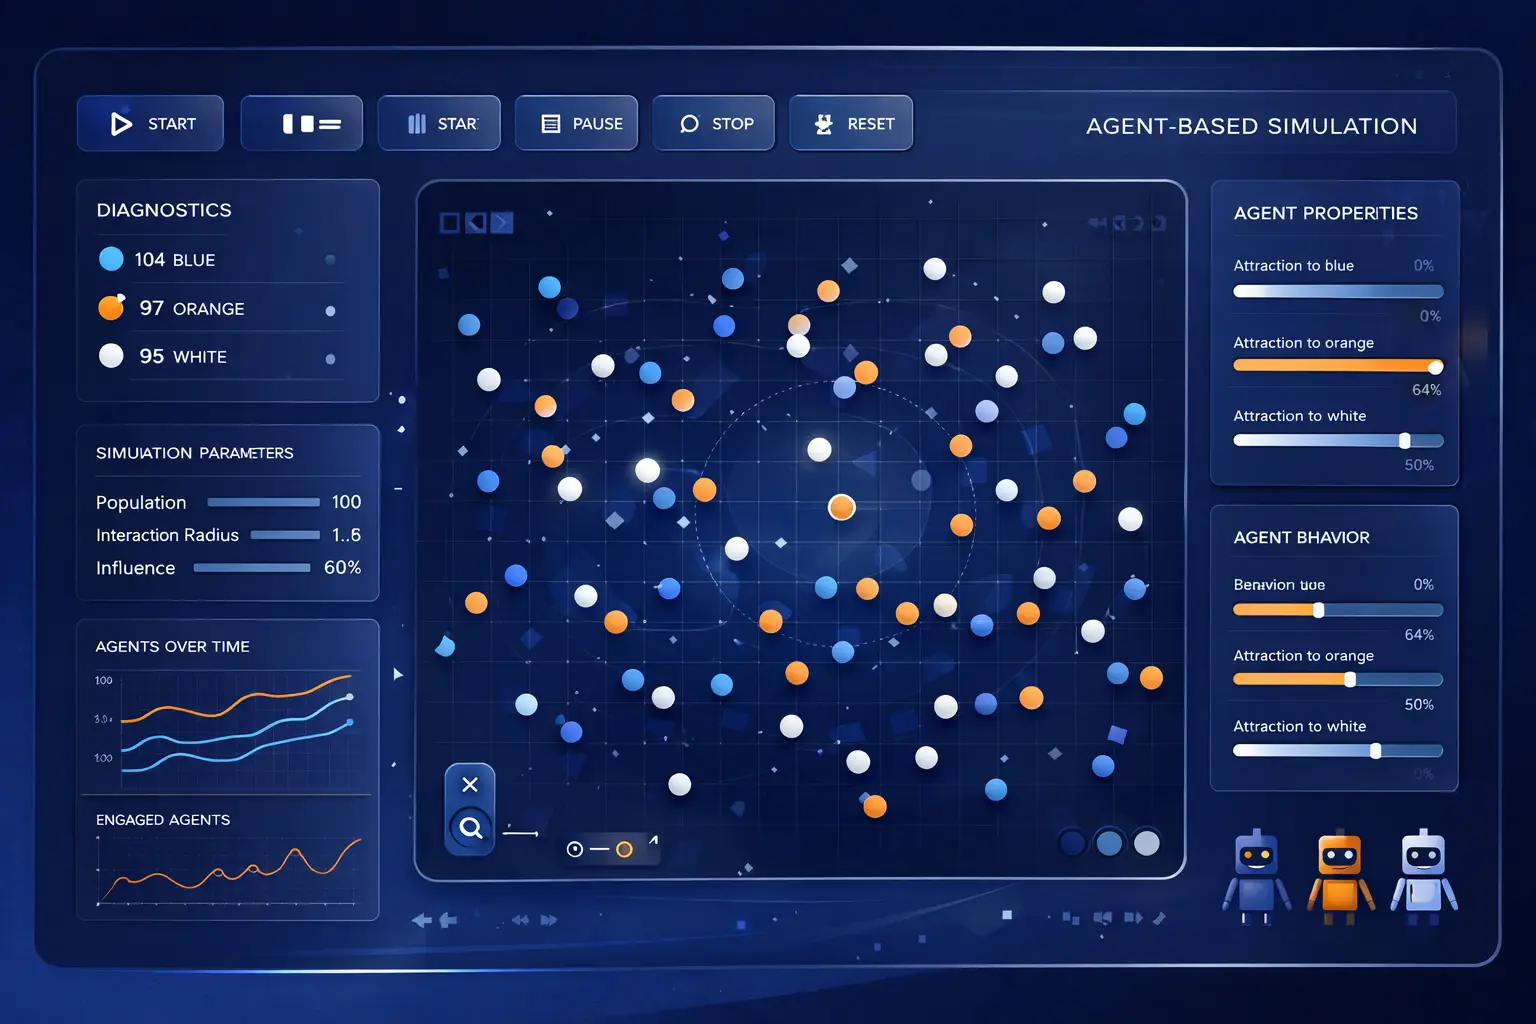
A key method here is agent-based modeling : individual agents (for example buyers, reps, trucks, teams, or policy actors) follow simple rules, and larger outcomes such as bottlenecks, cascades, adoption waves, or system failure emerge from their interactions.
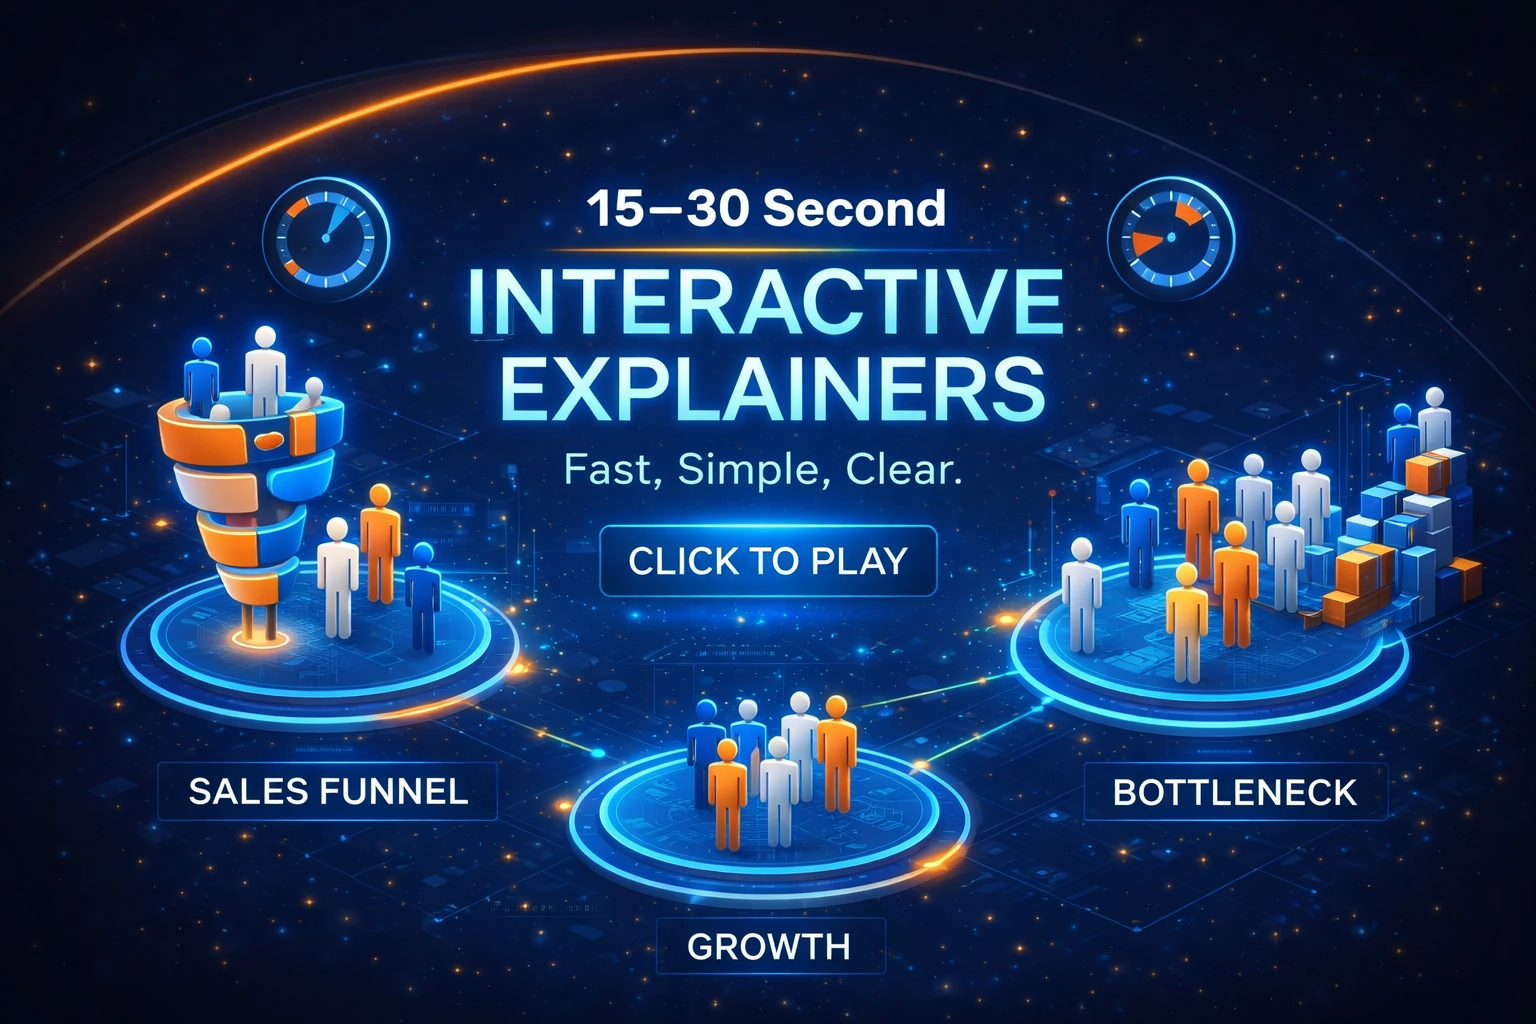
Simfluence takes these ABM-related foundations, adds software engineering and strong visual design, and turns them into 15–30 second interactive explainers that make a mechanism visible, testable, and easy to understand.
You move from abstract claims to visible system behavior: feedback loops, tipping points, bottlenecks, and fragility your audience can instantly grasp.
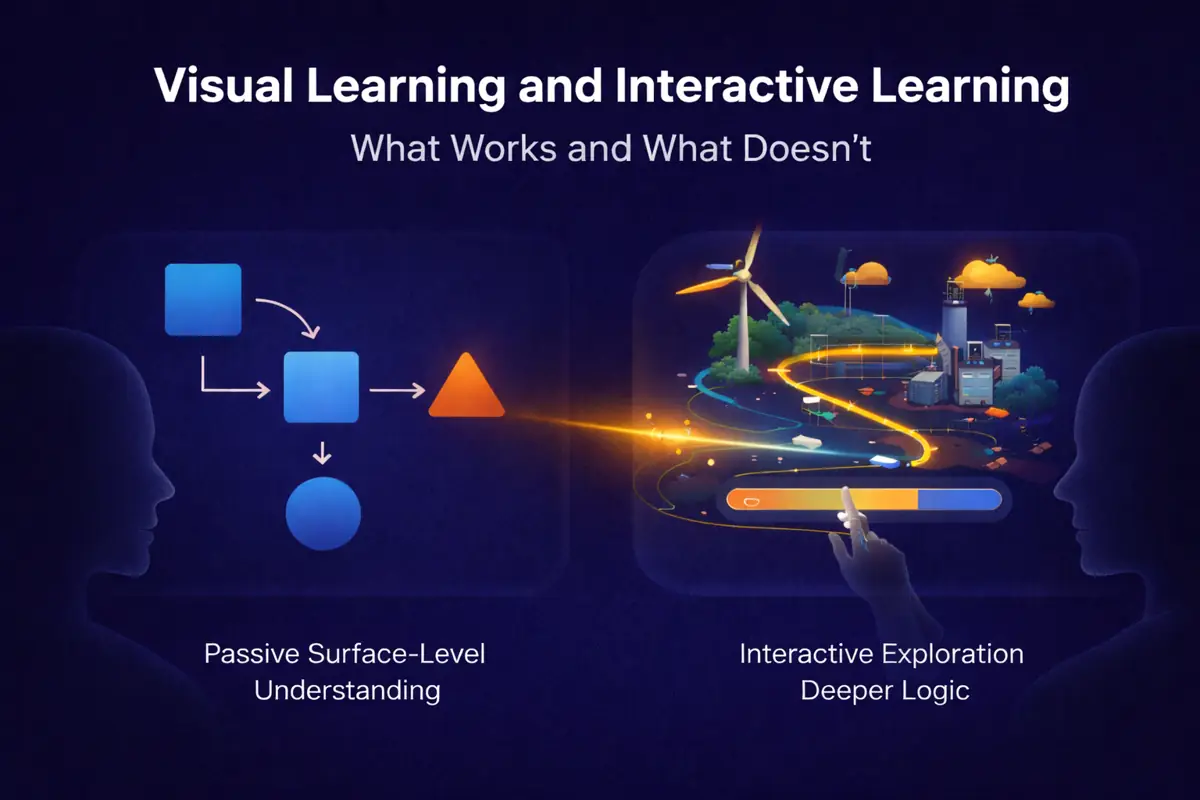
People remember cause and effect far better when they can watch the mechanism unfold, interact with it, and see the system break or recover in seconds.