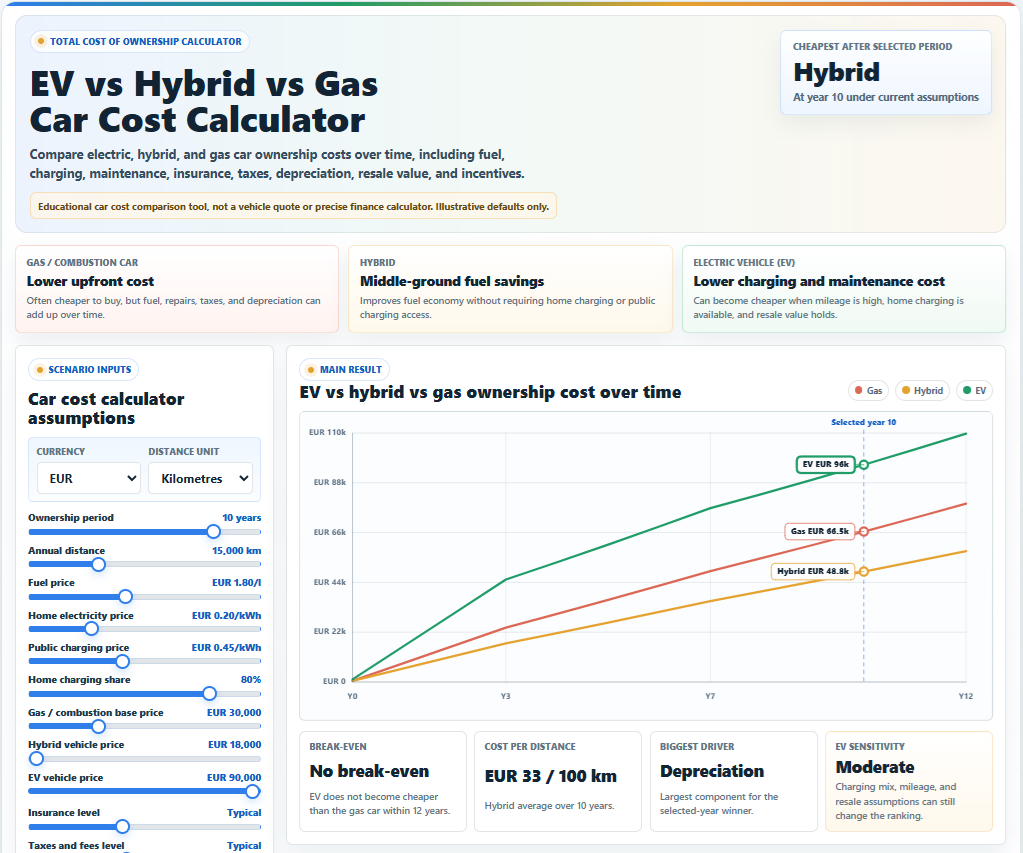
Agri-tech Simulation Template: Plant Yield & Quality Simulator
Adjust water, nutrients, and growing conditions to see how plant condition, quality, size mix, and final yield change across the season in one clear interactive simulation.
Browse interactive simulations for explaining consumer behaviour models, decision support tools, consulting tools, scenario planning tools, or B2B interactive content
Adjust water, nutrients, and growing conditions to see how plant condition, quality, size mix, and final yield change across the season in one clear interactive simulation.
An interactive ROI calculator that shows how a project pays back over time. See upfront cost, launch delay, revenue ramp, break-even timing, and profit growth in one simple view. The simulation makes return on investment over time easier to understand than a static chart. Based on common ROI content patterns, “ROI,” “return on investment,” “break-even,” and “ROI over time” match the clearest search intent for this page.
Product adoption curve simulator that models how understanding, social proof, and bridge strength shape diffusion across innovators, early adopters, mainstream users, and risk-averse segments.
A reusable side-by-side simulation template that shows how the same inputs produce different results under a baseline versus improved operating approach. Use it to explain workflow redesign, automation, routing, prioritization, or process improvement across service operations, support, revenue workflows, case handling, and internal processes.
Make revenue leakage visible in under 20 seconds. This interactive widget shows how manual sales workflows collapse under inbound spikes — and how FlowGuard AI stabilises lead flow with fast routing, instant booking, and smarter qualification.
Explore Sales Funnel Stages in live simulation. Watch how leads move through sales funnel process steps and optimize your sales funnel management accordingly.
Customer flow models visualize how people enter a system, progress through stages such as awareness, sign-up or purchase, and eventually convert or drop off. By simulating these dynamics, organizations can identify bottlenecks, friction points and conversion opportunities across the customer journey.
One city and one 10-driver pool, two operating models. The left panel shows customers facing expensive, less certain street-style service while drivers burn time waiting at stands. The right panel coordinates matching, ordering, and payment so more customers can afford to take trips and drivers can either finish sooner for the same pay or stay out and earn more.
This is not about one bad evening. It shows what repeated short-form doomscrolling can train over months: more daily scrolling, more brainrot habit, and less room left for deep focus.
This widget shows one simple idea: AI may be able to do many tasks, but companies adopt it slowly. As the sim runs, you can see how that delay may affect some jobs, new hiring, and other work signals. It is a simple demo, not a prediction.
Compare manual workflow vs automated workflow for 500-day hours saved, follow-up work, labor cost impact, and queue backlog.
How small control failures silently become audit disasters. Watch missed checks, documentation gaps, and audit timing turn manual work into hidden risk across 500 workdays.
Small errors look harmless day to day, then stack into audit exposure.
Use this stock profit calculator to estimate investment return, net profit, ROI, fees, dividends, taxes, and break-even in one interactive view. Compare buy, current, and predicted outcomes fast.
A single defect enters a production network in both panels. The left side has no lot traceability, so recall scope explodes. The right side isolates only traced batches and contains the blast radius.
One full hour of retail checkout activity, played back at 10x, 25x, 100x, 200x, or 400x speed. Sliders define the scenario before the run; changing any of them restarts the hour from the beginning.
Use this base for ordered multi-stage systems. It fits sales funnels, lead flows, onboarding pipelines, drop-off journeys, approval chains, service handoff paths, and any process where each stage affects final conversion. The template makes stage gates, leakage points, and downstream impact visible fast.
Use this base for linked systems where spread depends on connectivity and thresholds. It fits adoption spread, contagion, referral loops, peer influence, cascading failures, information diffusion, trust propagation, and other network effects where local connections shape global outcomes. The template is built to make saturation, resistance, clustering, and tipping points easy to see.
A 15-second, interactive factory flow simulation that shows how bottlenecks and downtime spread—and how AI coordination restores throughput under real variability.
Shows how product understanding spreads through a market—and why interactive simulations trigger faster adoption than static decks, PDFs, and landing pages. Visualizes threshold-driven cascades, influencer activation, and cross-segment diffusion.
This is the reusable Simfluence base widget. It is designed as a flexible template for many different simulation fields: operations, sales funnels, customer flows, logistics, service systems, workforce allocation, process bottlenecks, and other causal systems. The structure stays stable while the labels, metrics, controls, and logic can be tuned to fit each use case.
Use this base for physical flow systems where space and capacity interact. It fits queues, bays, stations, service points, warehouses, yards, docks, checkout lines, loading zones, and other congestion problems where layout, arrivals, service capacity, and movement rules shape delay and throughput. The template is built to make waiting, blocking, service pressure, and spatial bottlenecks visible fast.
map waiting and service zones clearly
How individual digital habits shape network behavior. Adjust Digital World and Real World entertainment to see how individual habits scale into network-wide shifts — fast enough to feel in ~10 seconds.
Small assumption gaps compound into visible drift while everyone believes they’re aligned.
Demonstrate how distribution yards collapse under peak load — and how DockFlow prevents congestion, SLA penalties, and idle asset costs through intelligent dock orchestration.
A reusable simulation template that shows how rising demand creates delay, leakage, and workflow strain, and how a stabilizer layer such as automation, orchestration, or added capacity helps protect outcomes and keep business value moving.