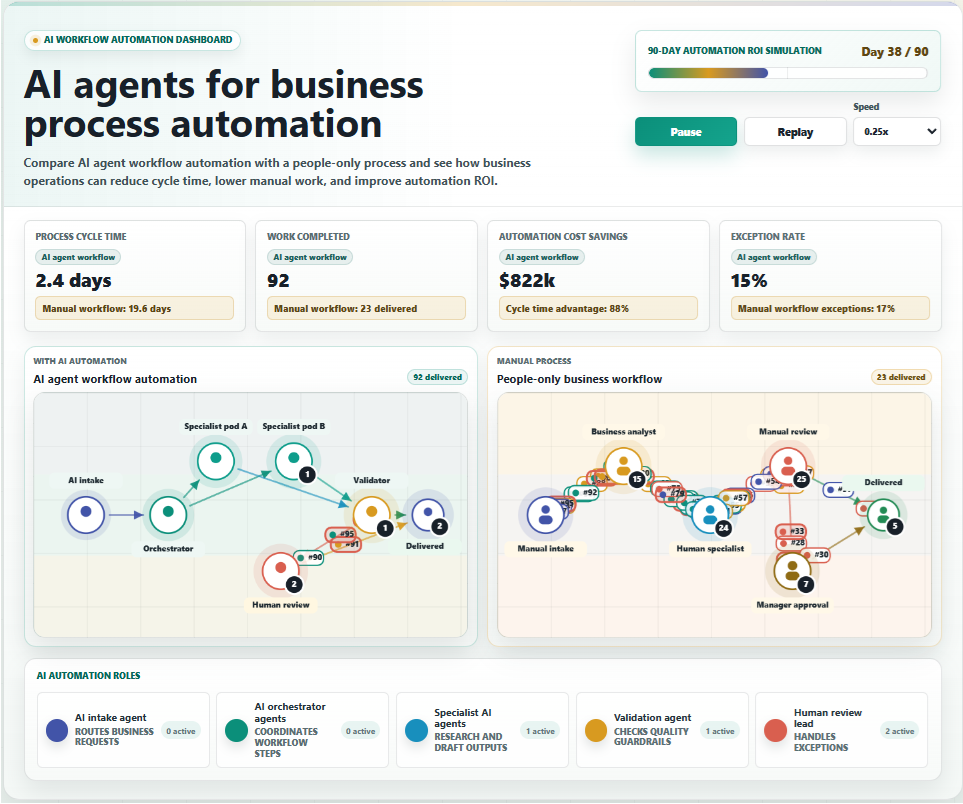
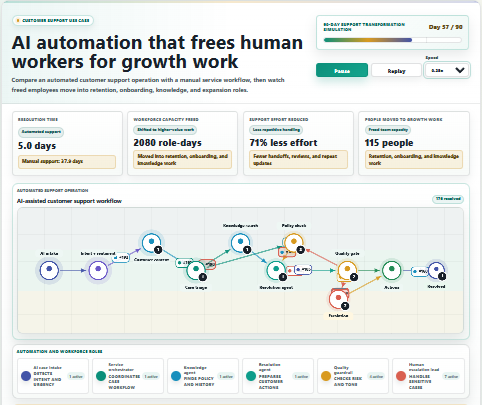
Agri-tech Simulation Template: Plant Yield & Quality Simulator
Adjust water, nutrients, and growing conditions to see how plant condition, quality, size mix, and final yield change across the season in one clear interactive simulation.
Efficiency & Operations simulations visualize how workflows behave under real conditions. They reveal bottlenecks, idle capacity, coordination failures and process inefficiencies through interactive process simulation models.
Adjust water, nutrients, and growing conditions to see how plant condition, quality, size mix, and final yield change across the season in one clear interactive simulation.
Make revenue leakage visible in under 20 seconds. This interactive widget shows how manual sales workflows collapse under inbound spikes — and how FlowGuard AI stabilises lead flow with fast routing, instant booking, and smarter qualification.
Explore Sales Funnel Stages in live simulation. Watch how leads move through sales funnel process steps and optimize your sales funnel management accordingly.
Customer flow models visualize how people enter a system, progress through stages such as awareness, sign-up or purchase, and eventually convert or drop off. By simulating these dynamics, organizations can identify bottlenecks, friction points and conversion opportunities across the customer journey.
One city and one 10-driver pool, two operating models. The left panel shows customers facing expensive, less certain street-style service while drivers burn time waiting at stands. The right panel coordinates matching, ordering, and payment so more customers can afford to take trips and drivers can either finish sooner for the same pay or stay out and earn more.
Compare manual workflow vs automated workflow for 500-day hours saved, follow-up work, labor cost impact, and queue backlog.
How small control failures silently become audit disasters. Watch missed checks, documentation gaps, and audit timing turn manual work into hidden risk across 500 workdays.
Small errors look harmless day to day, then stack into audit exposure.
A single defect enters a production network in both panels. The left side has no lot traceability, so recall scope explodes. The right side isolates only traced batches and contains the blast radius.
One full hour of retail checkout activity, played back at 10x, 25x, 100x, 200x, or 400x speed. Sliders define the scenario before the run; changing any of them restarts the hour from the beginning.
A 15-second, interactive factory flow simulation that shows how bottlenecks and downtime spread—and how AI coordination restores throughput under real variability.