
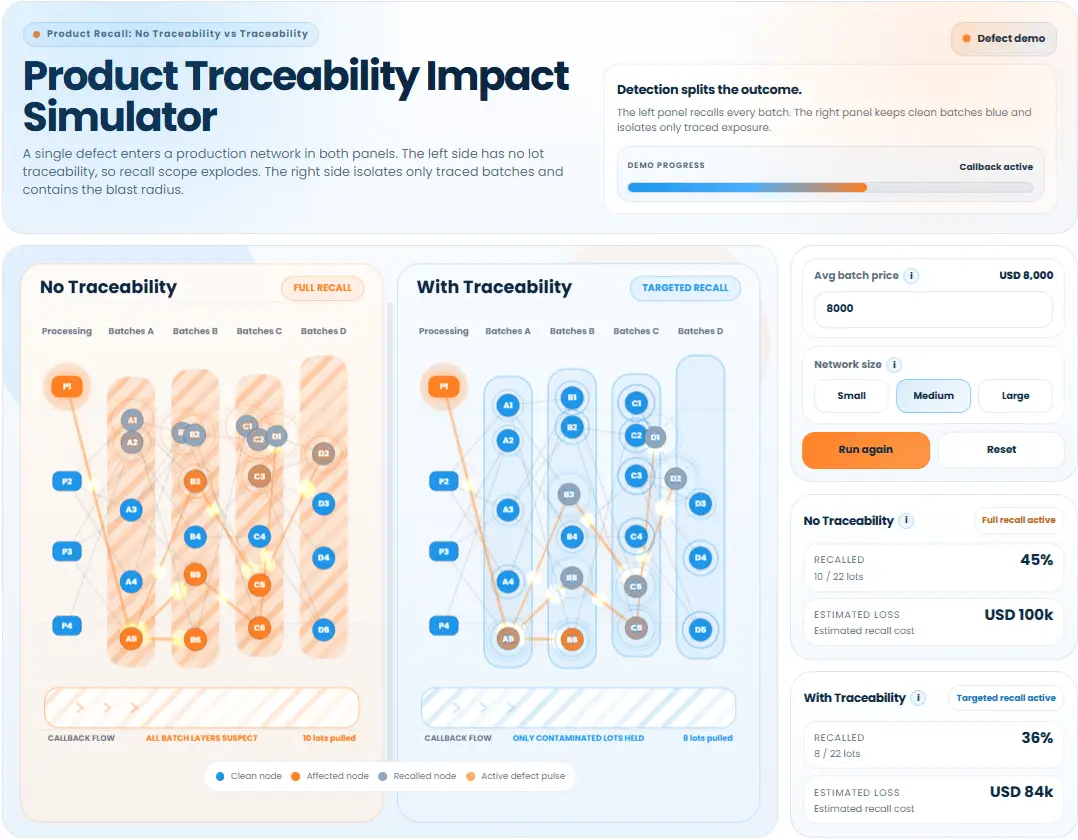
Product Recall — No Traceability vs Traceability
A single defect enters a production network in both panels. The left side has no lot traceability, so recall scope explodes. The right side isolates only traced batches and contains the blast radius.
Simulations and articles exploring how operational failures, system disruptions and strategic mistakes lead to financial losses. In complex systems, small issues can propagate through networks and create significant economic consequences. These simulations help visualize how risks translate into financial outcomes.
Financial loss simulations are especially useful for illustrating how risk management, operational efficiency and system reliability influence business performance. By modeling different failure scenarios, organizations can better understand the economic impact of disruptions.
A single defect enters a production network in both panels. The left side has no lot traceability, so recall scope explodes. The right side isolates only traced batches and contains the blast radius.
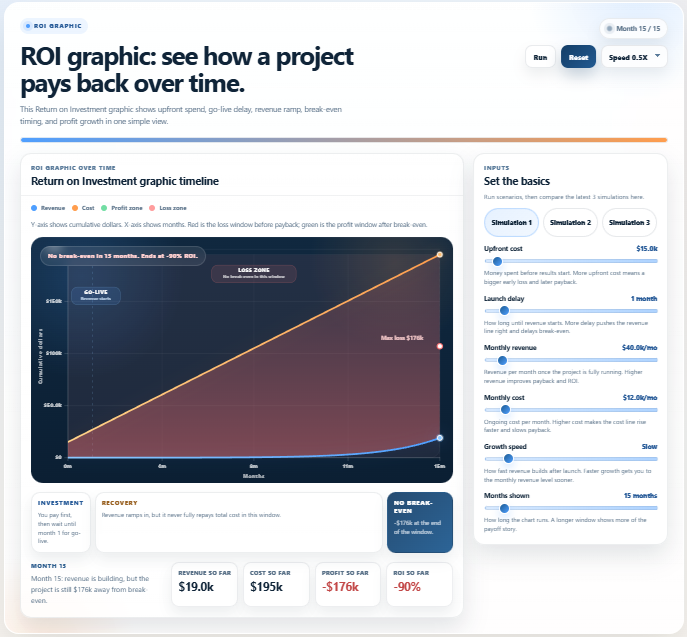
An interactive ROI calculator that shows how a project pays back over time. See upfront cost, launch delay, revenue growth, break-even timing, and profit growth in one view. The simulation makes return on investment over time easier to understand than a static chart.
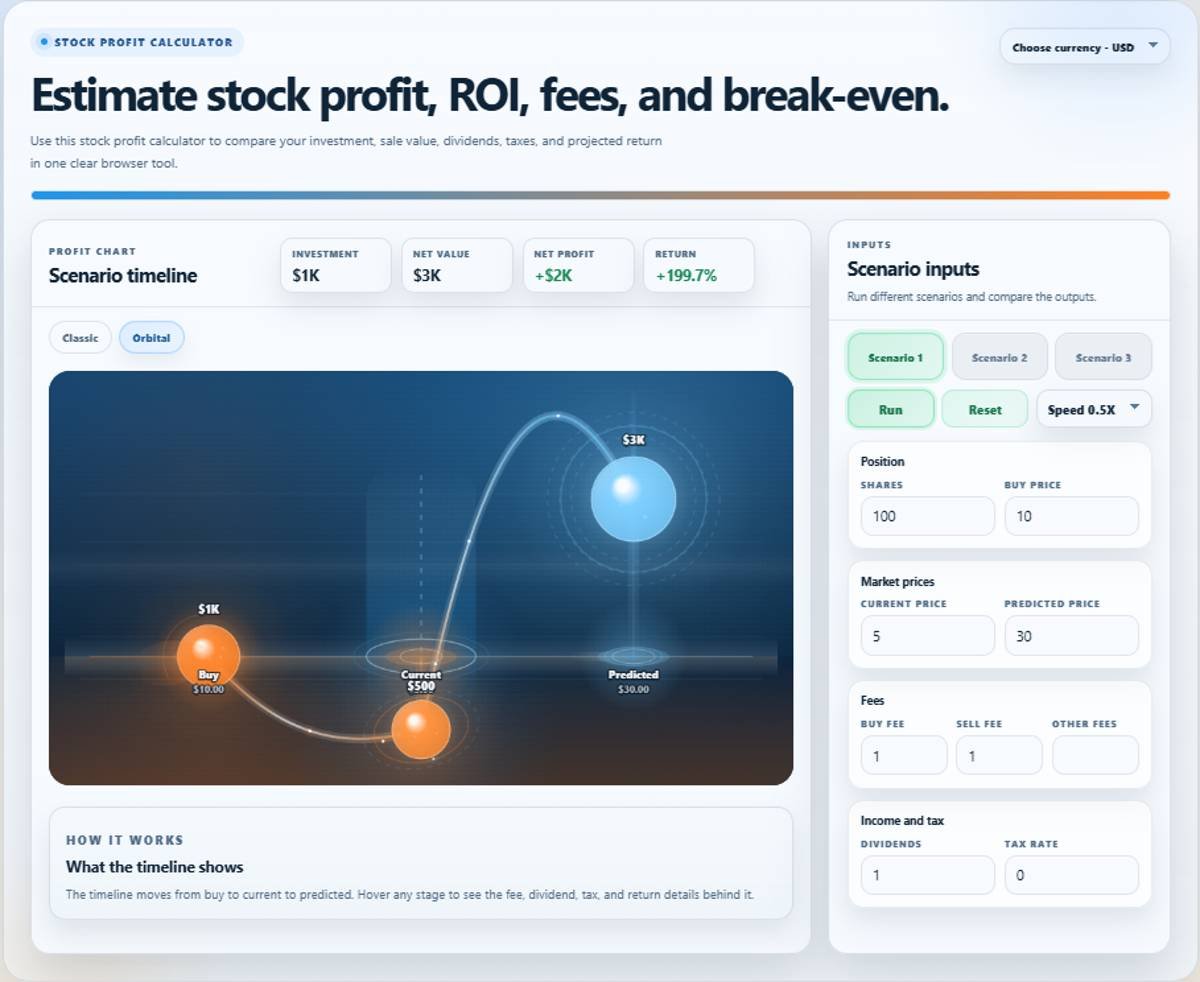
Use this stock profit calculator to estimate investment return, net profit, ROI, fees, dividends, taxes, and break-even in one interactive view. Compare buy, current, and predicted outcomes fast.