roi calculator • payback timeline • break-even visualization
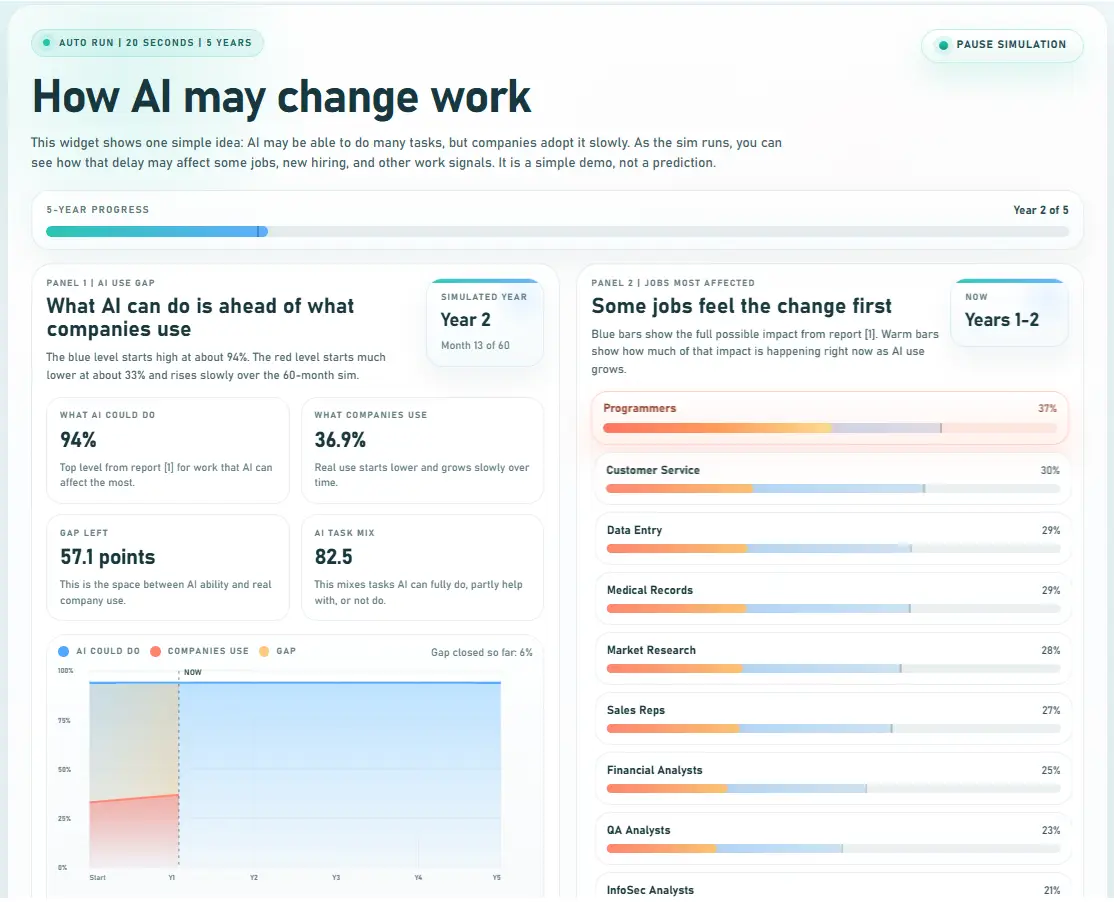
How to calculate and analyze ROI
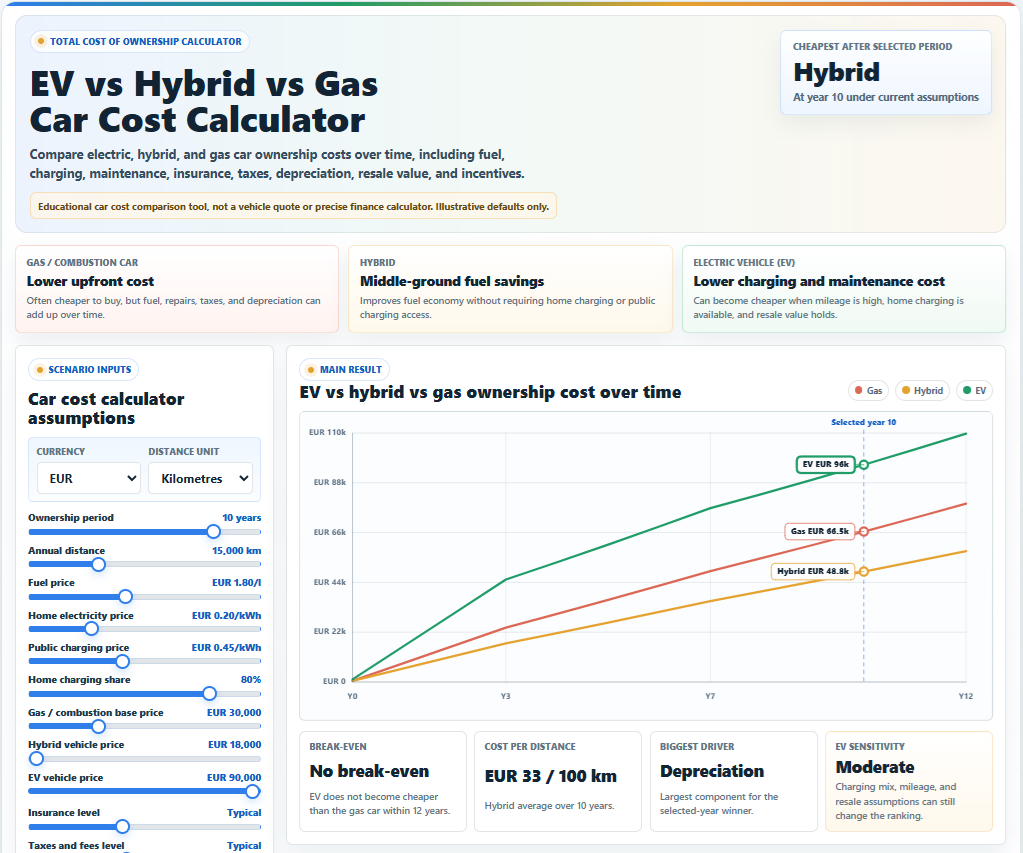
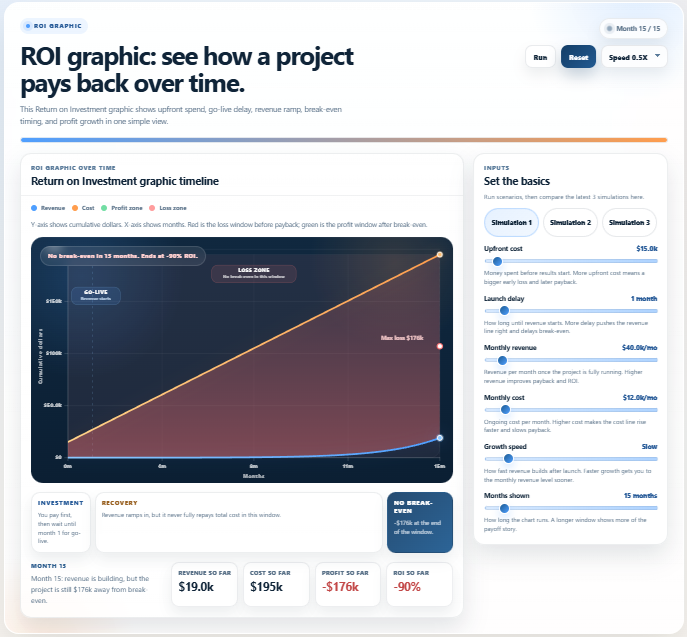
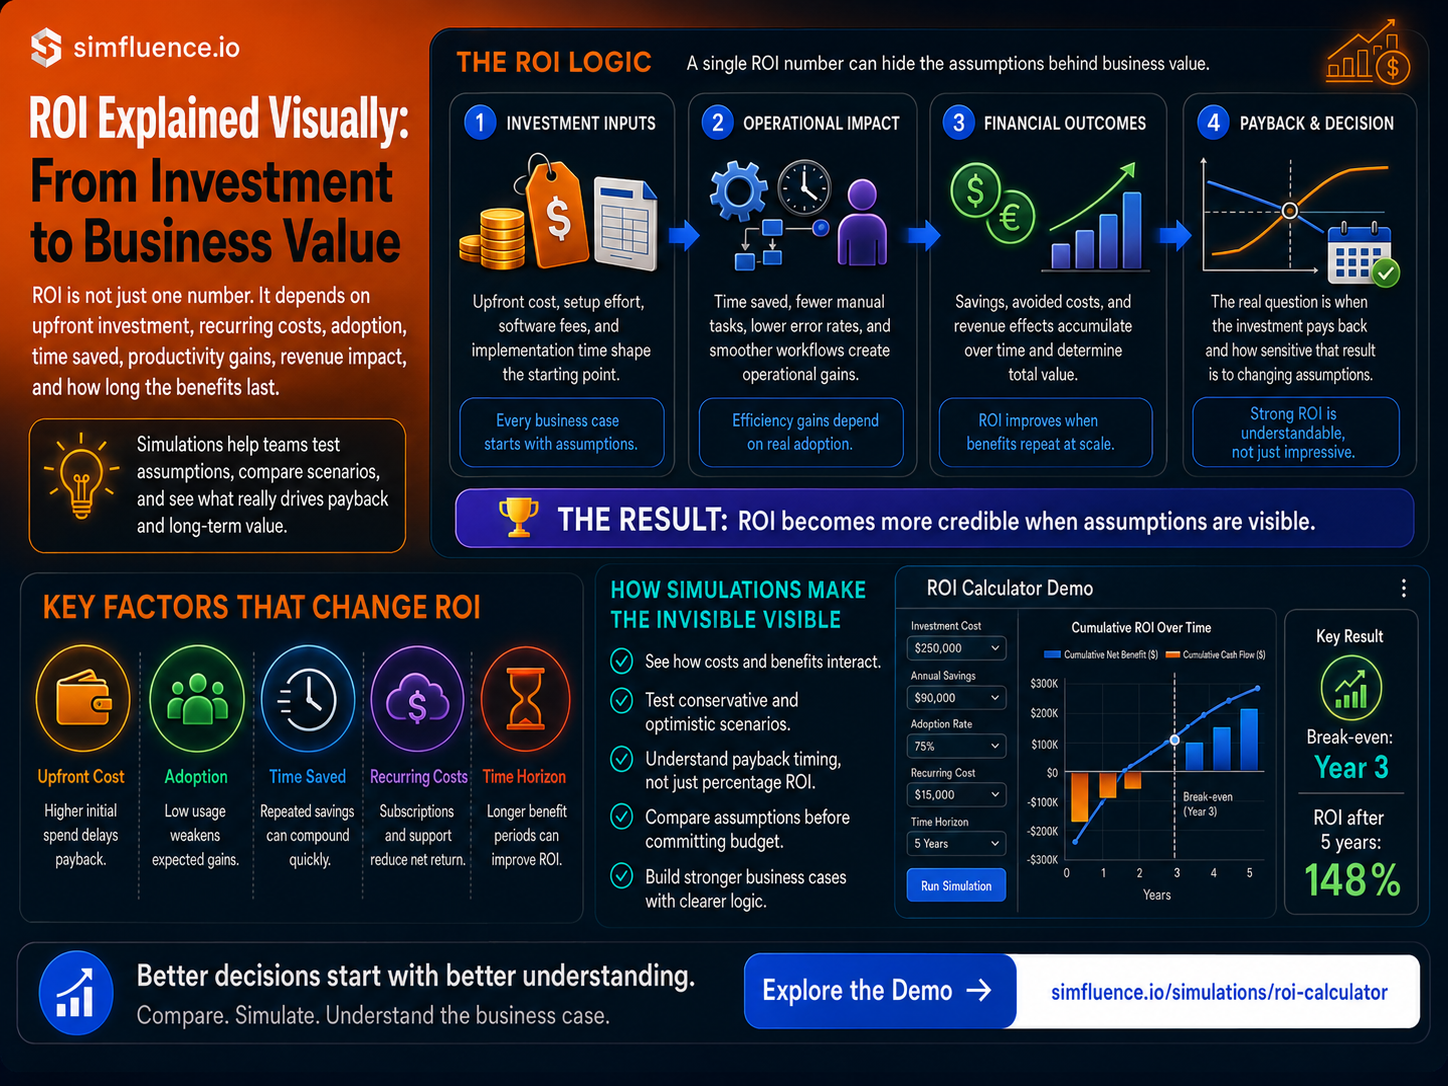
See how a project pays back over time in one simple view.
This return on investment graphic shows upfront spend, go-live delay, revenue ramp, break-even timing,
and profit growth on a single timeline. Users can quickly see where the project sits in the loss zone,
when it crosses into the profit zone, and how return builds month by month.
step 1 — set cost, delay, revenue, growth, and time window
step 2 — watch break-even and ROI change over time
revenue line
cost line
profit / roi outcome
break-even timing
what it shows
How upfront spend, launch delay, and revenue ramp shape the payback story over time.
Where the project sits in the loss zone, when it reaches break-even, and how profit builds after payback.
How changes to monthly revenue, monthly cost, and growth speed affect total ROI.
main view
roi timeline:cumulative dollars across months with cost and revenue on one clear chart
zone framing:red loss window before payback and green profit window after break-even
milestones:go-live start, break-even month, max loss point, and end-of-window outcome
run state:run, reset, speed control, and latest-run comparison across saved scenarios
live outputs
break-even:month 19 in the current scenario
roi so far:+102% by month 30
profit so far:+$1.9m total profit, with $3.8m revenue and $1.9m cost
max loss:$801k before recovery begins
best for
project payback and investment justification pages
software ROI explainers and business case storytelling
budget, finance, and go-live impact communication
what-if comparisons for cost, delay, and revenue scenarios
roi graphic
return on investment graphic
roi timeline
break-even visualization
payback period graphic
project roi chart
cost vs revenue timeline
profit growth visualization
investment payback simulation
roi over time
This simulation makes one thing visible fast:
ROI is not one number — it is a timing story shaped by upfront cost, revenue delay, ramp speed, and operating cost before the project finally crosses into profit.
Related blog post
ROI calculator explainer
Why ROI Calculators Make Business Value Easier to Understand
ROI is often presented as one simple number, but business value depends on assumptions. This article explains how ROI simulations make investment costs, operational gains, payback timing, adoption, and long-term value easier to understand.