
Automated Workflow Time Cost Simulator
Compare manual workflow vs automated workflow for 500-day hours saved, follow-up work, labor cost impact, and queue backlog.
Simulations and articles exploring how backlogs accumulate in service systems and operational workflows. When incoming demand exceeds processing capacity, queues begin to grow and backlogs emerge.
Simulation models help visualize how demand spikes, slow processing or coordination problems create growing queues. These insights help organizations design systems that maintain stable service performance.
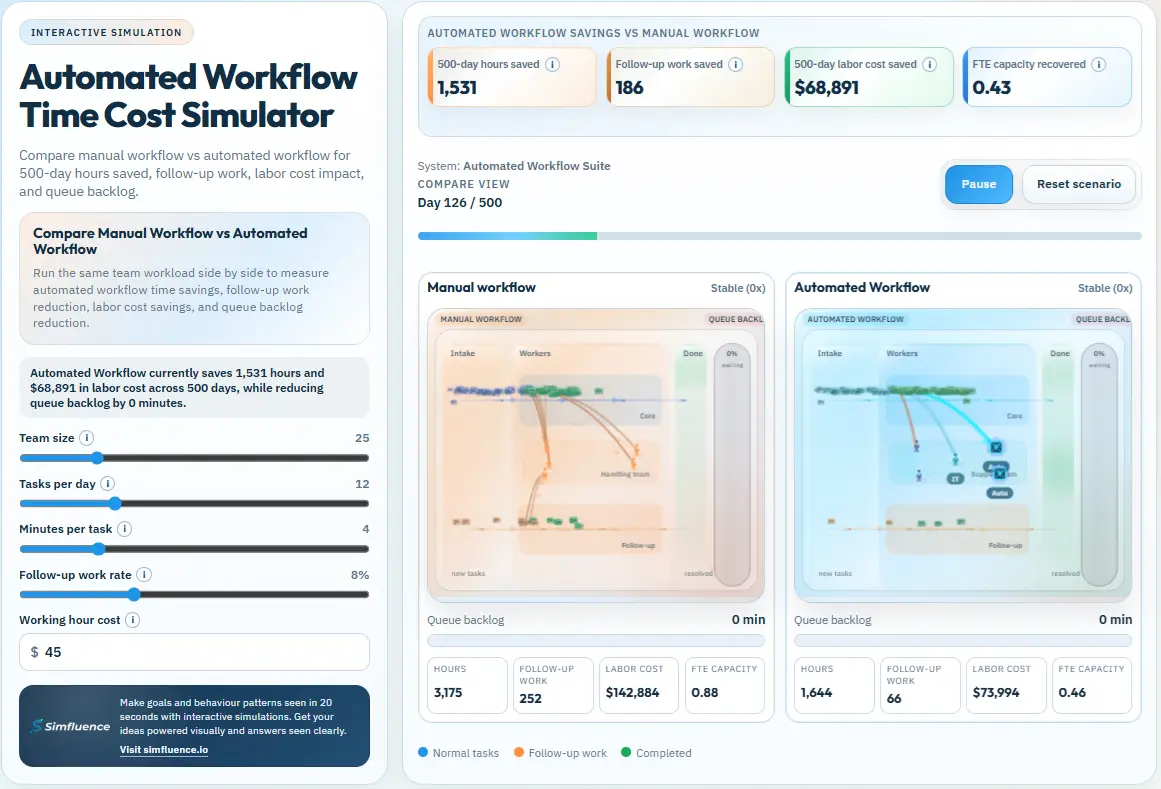
Compare manual workflow vs automated workflow for 500-day hours saved, follow-up work, labor cost impact, and queue backlog.
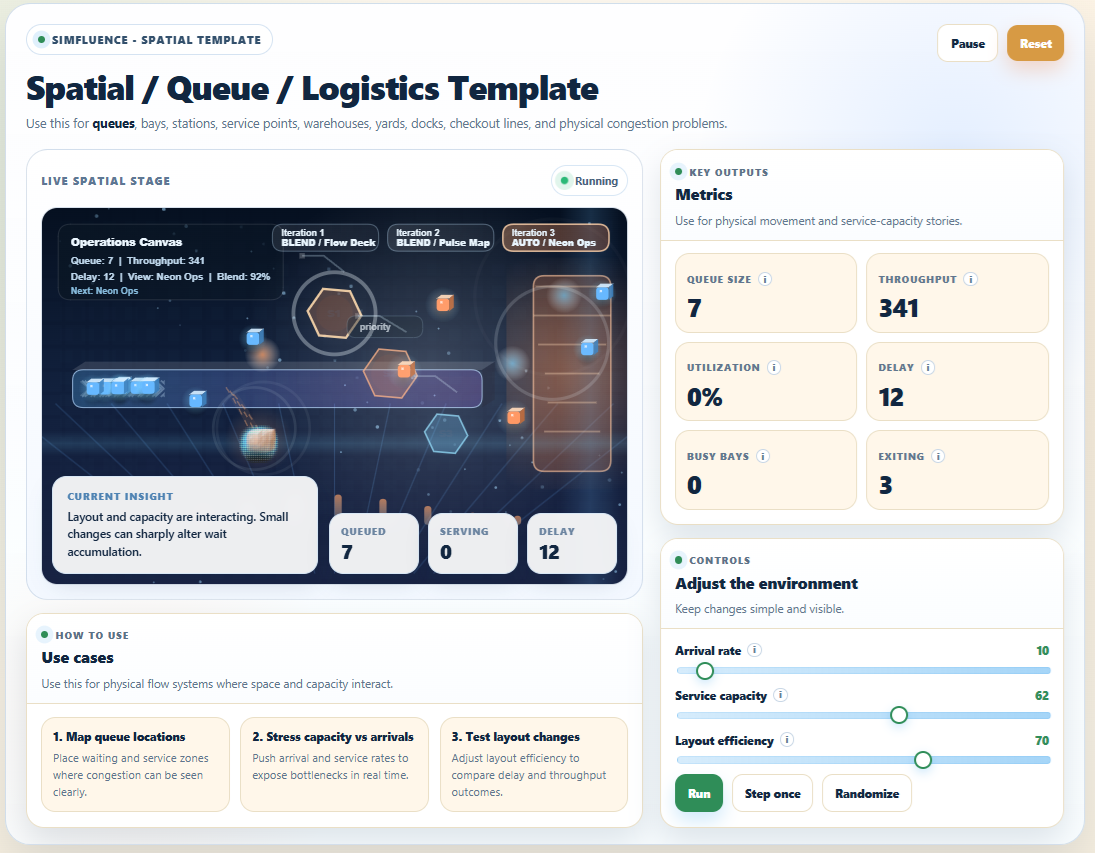
Use this base for physical flow systems where space and capacity interact. It fits queues, bays, stations, service points, warehouses, yards, docks, checkout lines, loading zones, and other congestion problems where layout, arrivals, service capacity, and movement rules shape delay and throughput. The template is built to make waiting, blocking, service pressure, and spatial bottlenecks visible fast.
map waiting and service zones clearly
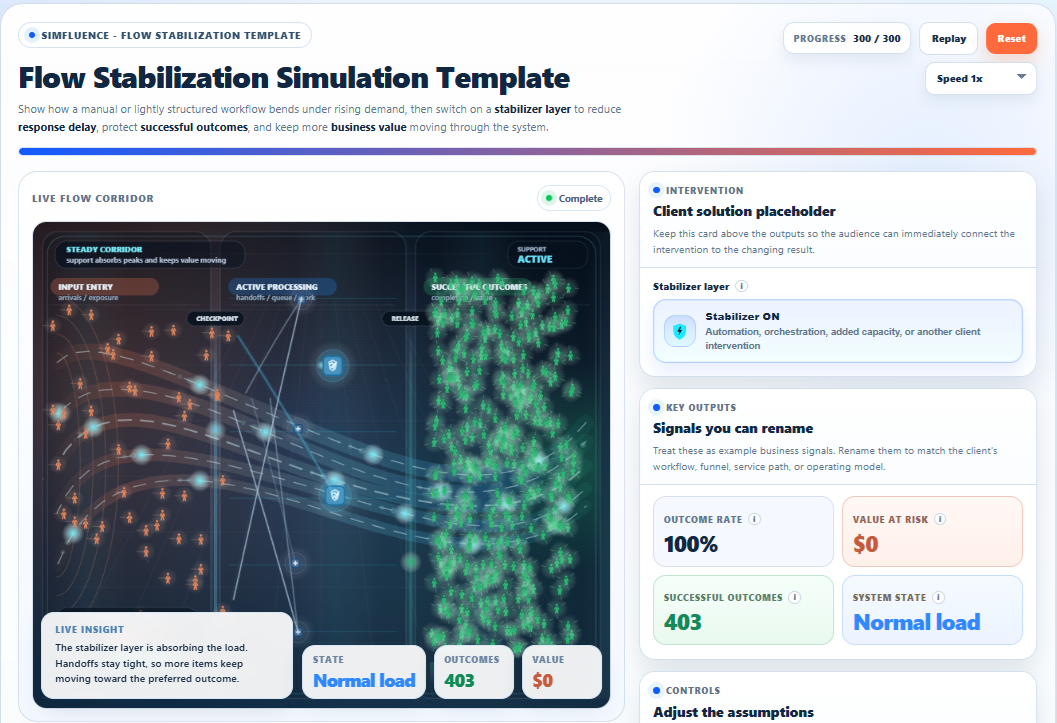
A reusable simulation template that shows how rising demand creates delay, leakage, and workflow strain, and how a stabilizer layer such as automation, orchestration, or added capacity helps protect outcomes and keep business value moving.