workflow • automation • time cost
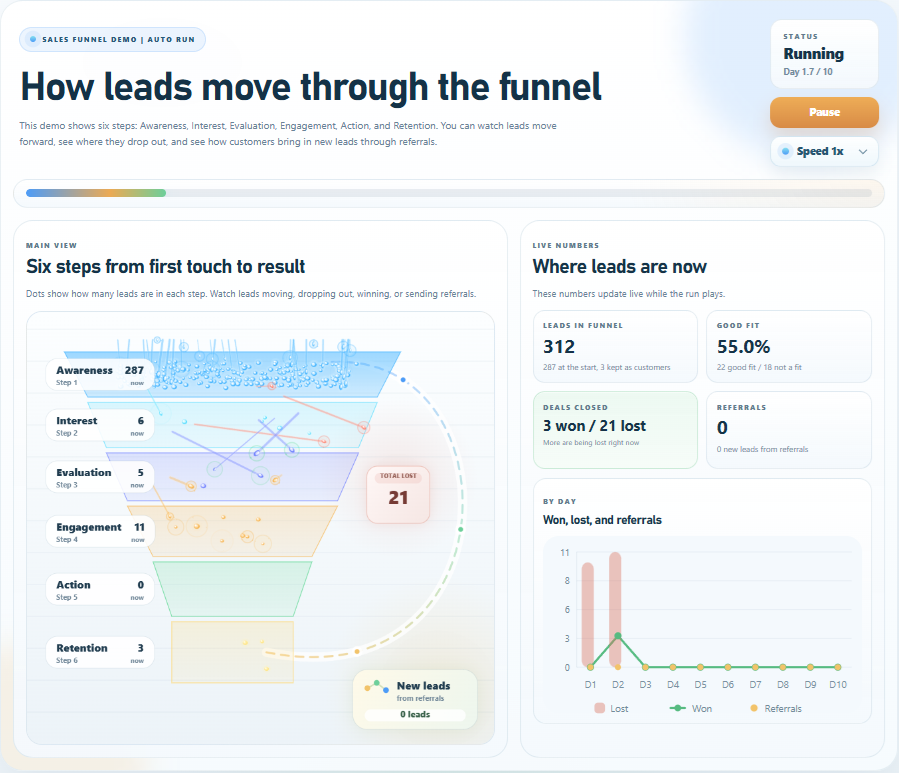
Automated Workflow Time Cost Simulator
Compare manual workflow vs automated workflow across the same workload.
See how automation changes hours used, follow-up work, labor cost, FTE capacity, and queue backlog over time.
step 1 — scenario setup
step 2 — run playback
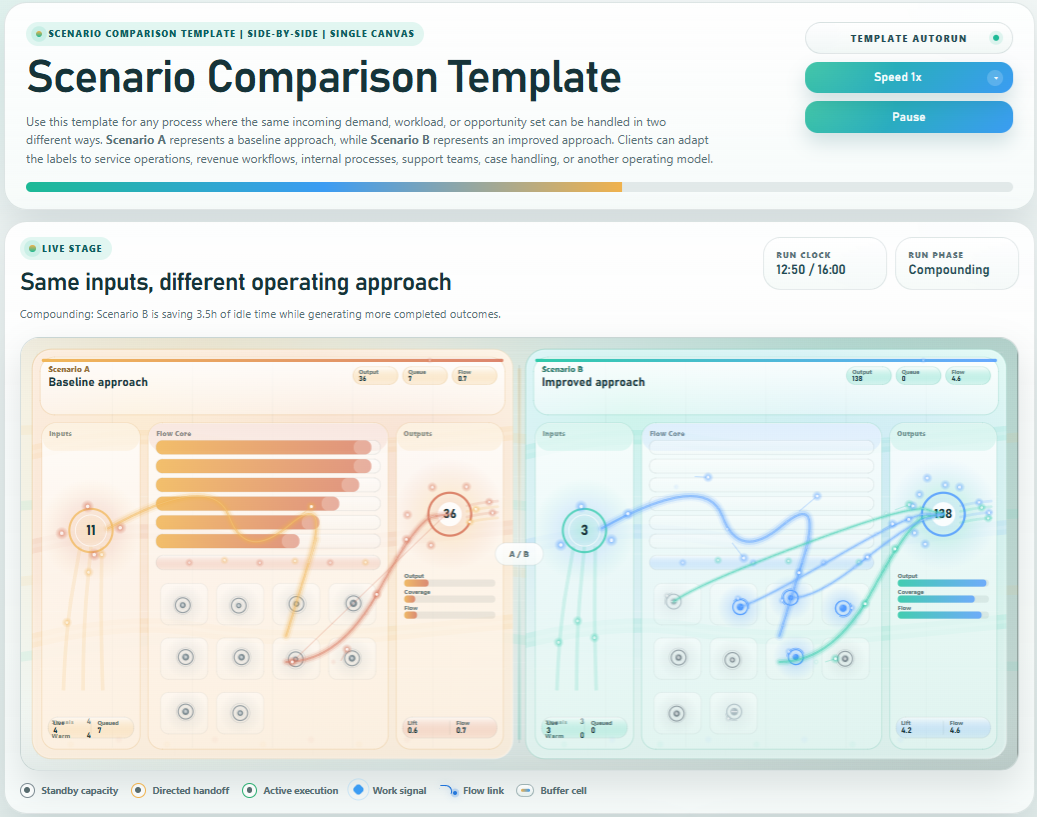
manual workflow
automated workflow
follow-up work
queue backlog
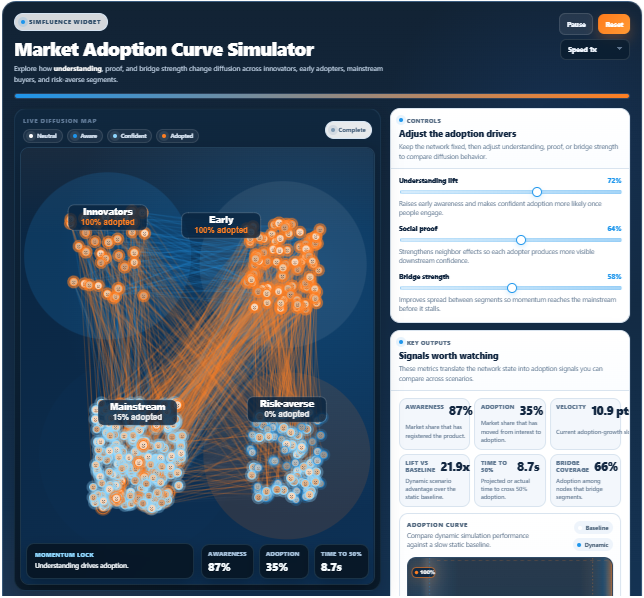
what it shows
How the same workload plays out under manual versus automated workflow handling.
How automation can reduce time spent, follow-up work, and labor cost depending on scenario inputs.
How recovered capacity appears as FTE savings, while backlog may shrink or remain stable based on input conditions.
core controls
team size:adjust workload capacity
tasks per day:set daily throughput demand
minutes per task:change handling time
follow-up work rate:set extra rework pressure
working hour cost:adjust cost impact
live outputs
hours saved:time difference over the full run
follow-up work saved:reduction in extra handling
labor cost saved:cost delta from reduced effort
FTE capacity recovered:usable team capacity regained
best for
workflow automation pages
ops efficiency sales conversations
ROI and capacity planning decks
process redesign workshops
workflow automation
time savings
labor cost
follow-up work
capacity recovery
FTE
queue backlog
operations
productivity
ROI
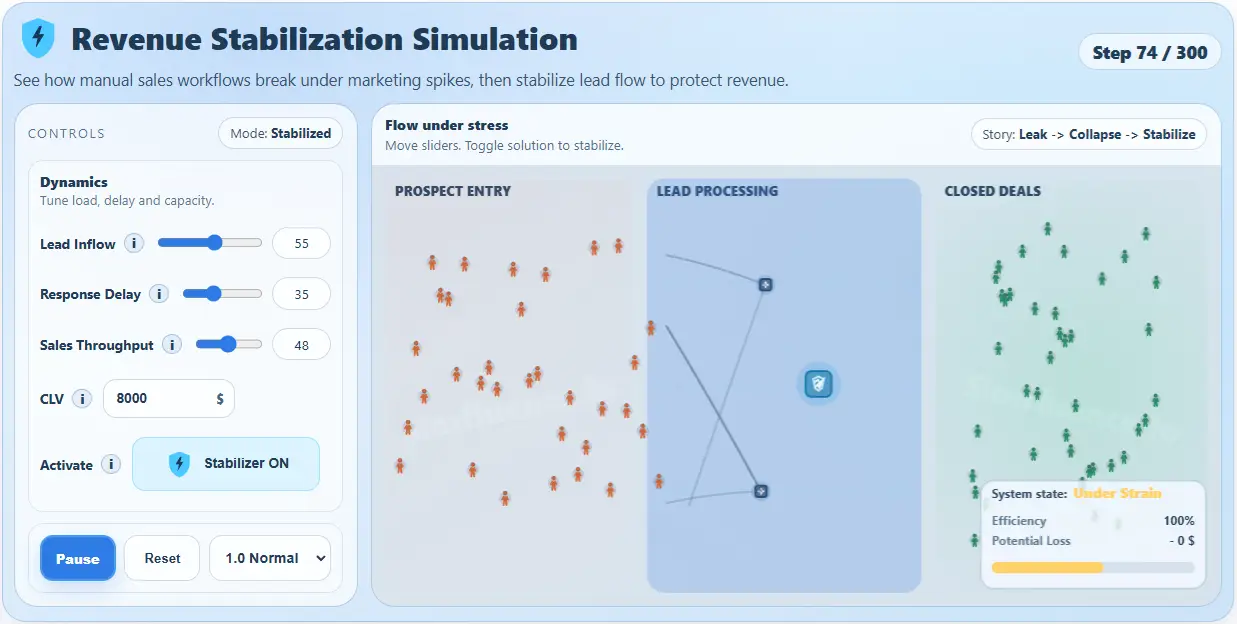
This simulation lets users test how automation changes operational drag under different workload assumptions.
Depending on the inputs, the automated workflow can reduce hours, follow-up work, and labor cost while
improving capacity availability and keeping queues more controlled.