Buying a car is usually presented as a simple comparison of prices, brands, models, and features. One car costs less upfront, another promises lower running costs, and a third offers newer technology or better efficiency. But this way of thinking often hides the real question. The cost of a car is not only the price paid on the day of purchase. It is the cost that builds up over years of use.
This is especially true when comparing gas cars, hybrids, and electric vehicles. A gas or combustion car may look cheaper at first because the purchase price is often lower. A hybrid may appear to be a practical compromise because it reduces fuel consumption without requiring charging access. An electric vehicle may look more expensive at the beginning, but its lower charging and maintenance costs can change the picture over time. The problem is that none of these conclusions is always true. The result depends on how the car is used, where it is charged or refuelled, how far it is driven, how long it is owned, and what happens to resale value.
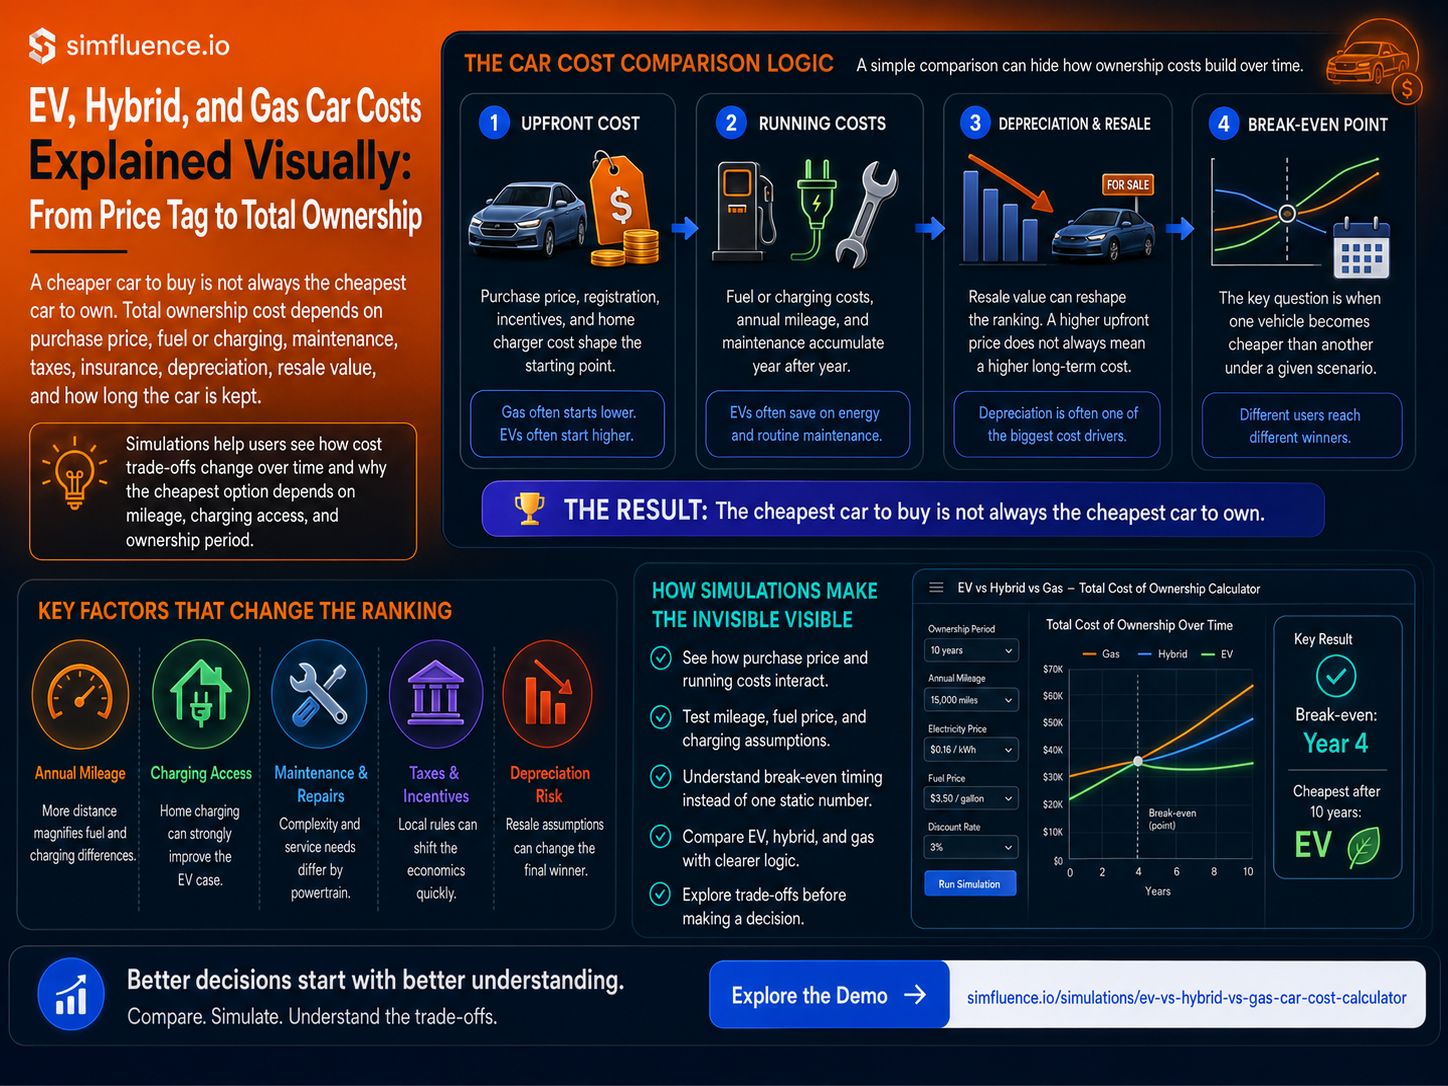
That is why we built the EV vs Hybrid vs Gas Car Cost Calculator.
The simulation is designed as an educational total cost of ownership tool. It does not try to replace a dealer quote, a financing offer, or a precise vehicle valuation. Instead, it helps users understand the basic ownership-cost logic behind different vehicle types. The goal is to make the trade-offs visible: when purchase price matters most, when fuel or charging costs start to dominate, when maintenance becomes important, and when depreciation changes the final result.
The purchase price is only the first layer of the decision. It is also the most visible layer, which is why many people give it too much weight. A cheaper gas car can become more expensive over time if fuel costs are high, annual mileage is high, and maintenance or repair costs accumulate. A more expensive EV can become competitive if the driver covers enough distance, charges mostly at home, and benefits from lower energy and maintenance costs. A hybrid can sit between the two, offering lower fuel use without the infrastructure dependency of an EV.
This is the main reason why a simulation works better than a static comparison. A written article can say that EVs often have lower running costs. It can also say that gas cars often have lower purchase prices. But those statements are too general. They do not show what happens when assumptions change. If fuel becomes more expensive, the gas car weakens. If public charging is used more than home charging, the EV advantage can shrink. If annual mileage is low, the EV may not have enough time to recover its higher purchase price. If resale value changes, the ranking can shift again.
An interactive calculator lets users test those assumptions directly. Instead of accepting one fixed conclusion, users can adjust the ownership period, annual distance, fuel price, electricity price, home charging share, purchase premiums, taxes, insurance, depreciation assumptions, and battery-risk assumptions. The result becomes less like a recommendation and more like a map of the system. This is also the broader logic behind Simfluence-style simulations: complex processes become easier to understand when users can interact with the assumptions.
We have used the same principle in other simulation-led explainers, including this article on how automation simulations make AI workflows easier to understand. The same idea applies here. Car ownership cost is not just a number. It is a process that unfolds over time. In the first few years, upfront price and depreciation may dominate. In the middle years, fuel, charging, insurance, and maintenance begin to accumulate. Over a longer period, resale value, repair risk, taxes, battery uncertainty, and policy changes can become more important. A good explainer should show these phases instead of compressing everything into one simplified claim.
One of the most useful outputs in the calculator is the break-even year. This shows when one vehicle type becomes cheaper than another under the selected assumptions. That matters because a car can be cheaper after ten years but still more expensive for the first three or four years. For someone who changes cars often, that distinction matters. For someone who keeps a vehicle for a decade, the long-term total may matter more. The same EV can be a strong financial choice for one driver and a weak one for another.
The simulation also helps explain why “EV vs gas” debates often become misleading. People usually compare different assumptions without noticing it. One person assumes cheap home charging and high annual mileage. Another assumes expensive public charging and low annual mileage. One person includes depreciation; another ignores it. One person assumes incentives; another assumes no policy support. Under those different conditions, both people may reach different conclusions and still be internally logical.
That is why the calculator includes more than fuel and charging costs. It also includes maintenance, insurance, taxes, depreciation, resale value, incentives, home charger cost, and EV battery-risk assumptions. These categories make the comparison more honest. They also prevent the simulation from becoming a simplistic “EV always wins” or “gas is always cheaper” message. The better conclusion is that vehicle cost depends on the scenario.
The calculator is especially useful for communication because it turns an abstract debate into a visible structure. Users can see that gas cars often start with an upfront advantage. They can see that hybrids reduce fuel exposure. They can see that EVs depend heavily on charging access, mileage, and resale assumptions. They can also see how sensitive the result is. If small changes in assumptions reverse the ranking, that tells users to be cautious. If the result stays stable across different assumptions, the conclusion is stronger.
This makes the tool useful not only for individual car buyers, but also for educators, analysts, sustainability communicators, mobility companies, and public-sector teams. It can support conversations about electric mobility, energy prices, household budgeting, emissions policy, charging infrastructure, and long-term consumer decisions. The point is not to tell every user which car to buy. The point is to help them understand what drives the cost difference.
For more examples of simulation-led explanation, see the Simfluence blog.
The EV vs Hybrid vs Gas Car Cost Calculator is therefore best understood as a thinking tool. It simplifies reality, but it does so openly. It uses illustrative defaults, shows the assumptions, and makes clear that real-world results depend on country, taxes, subsidies, energy prices, car segment, repair markets, driving behaviour, and resale conditions. That transparency matters because every car cost calculator has limits. The useful ones make those limits visible.
Try the EV vs Hybrid vs Gas Car Cost Calculator here:
https://simfluence.io/simulations/ev-vs-hybrid-vs-gas-car-cost-calculator/
Adjust the assumptions and watch how the result changes. The most valuable outcome may not be the final winner. It may be understanding why the winner changes.