
Factory Flow Simulation for Bottlenecks, Downtime, and Throughput
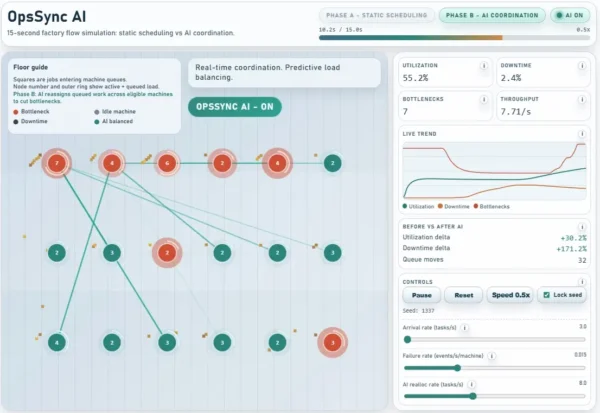
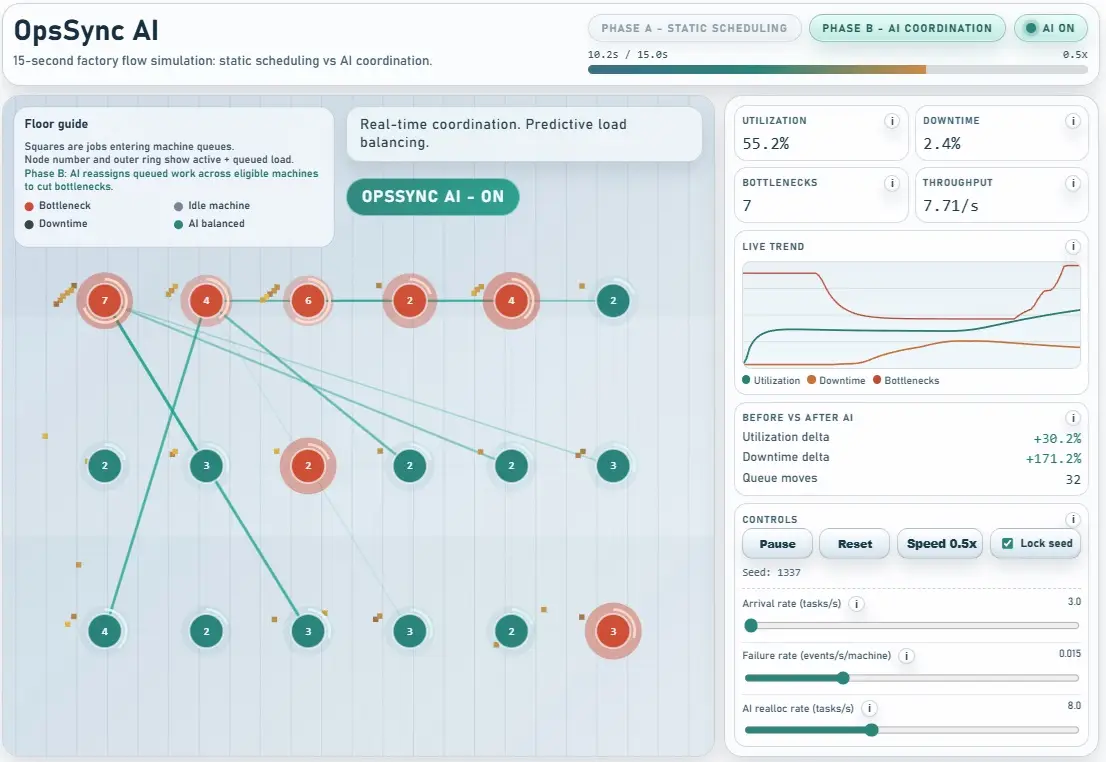
A 15-second, interactive factory flow simulation that shows how bottlenecks and downtime spread—and how AI coordination restores throughput under real variability.
A 15-second, interactive factory flow simulation that shows how bottlenecks and downtime spread—and how AI coordination restores throughput under real variability.
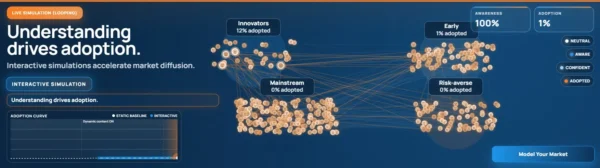
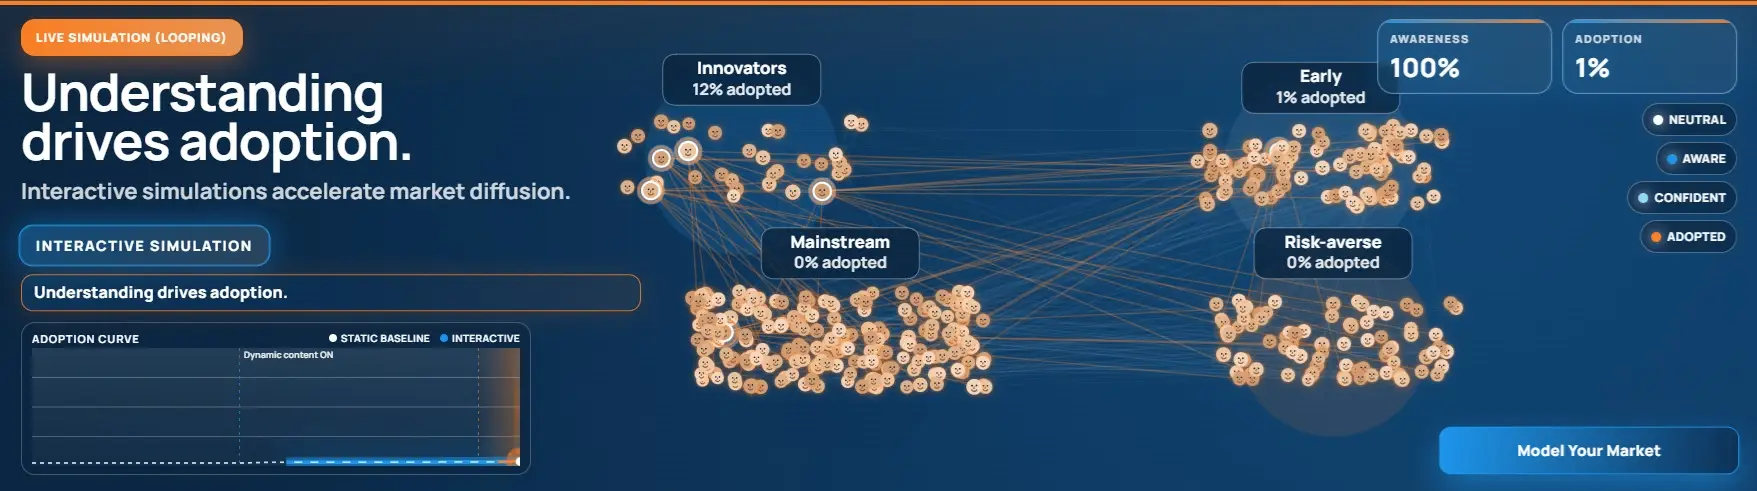
Shows how product understanding spreads through a market—and why interactive simulations trigger faster adoption than static decks, PDFs, and landing pages. Visualizes threshold-driven cascades, influencer activation, and cross-segment diffusion.
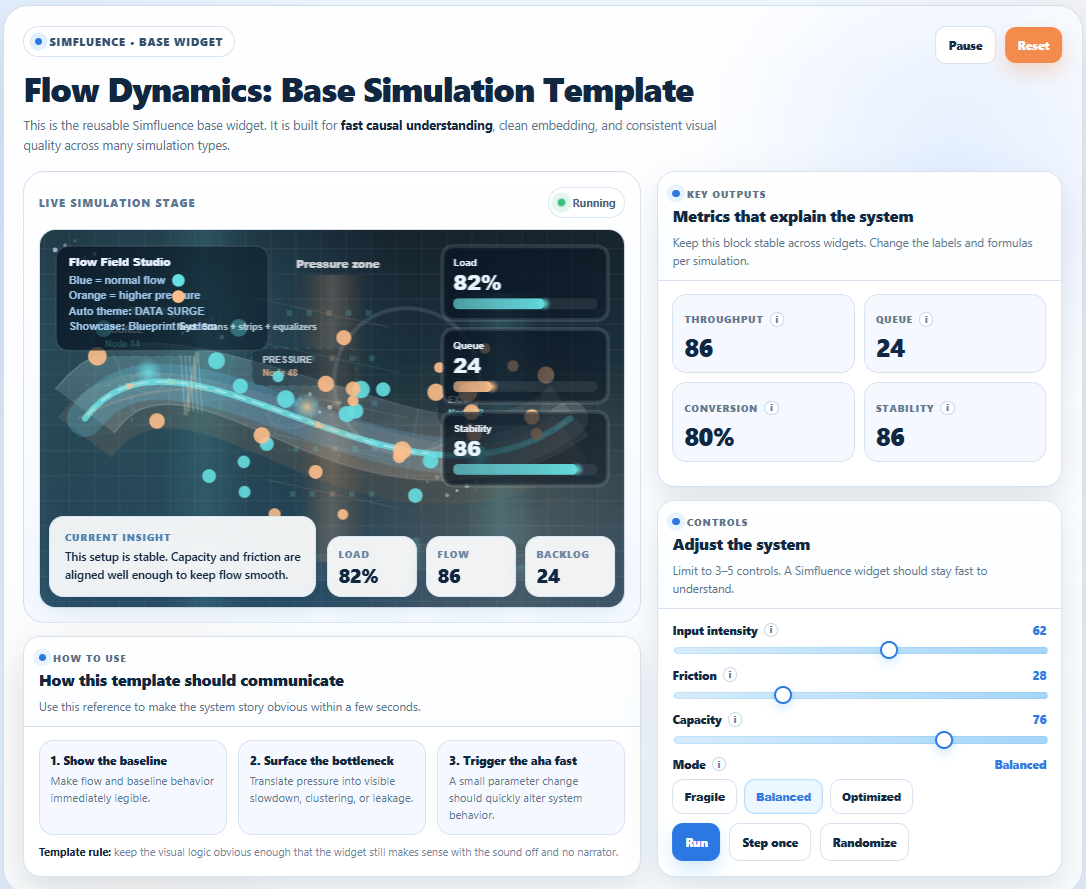
This is the reusable Simfluence base widget. It is designed as a flexible template for many different simulation fields: operations, sales funnels, customer flows, logistics, service systems, workforce allocation, process bottlenecks, and other causal systems. The structure stays stable while the labels, metrics, controls, and logic can be tuned to fit each use case.
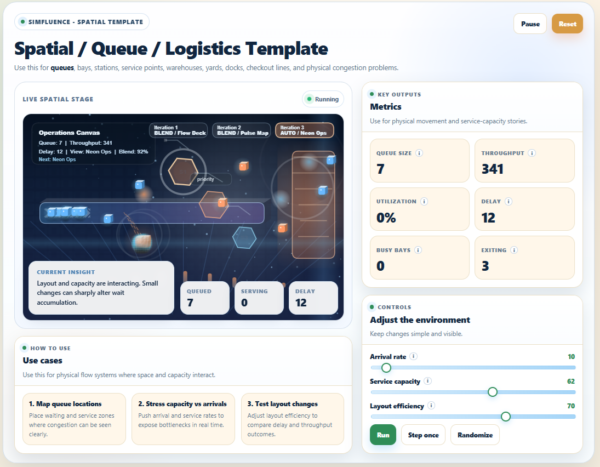
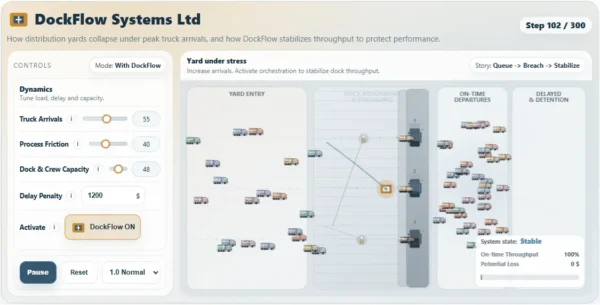
Use this base for physical flow systems where space and capacity interact. It fits queues, bays, stations, service points, warehouses, yards, docks, checkout lines, loading zones, and other congestion problems where layout, arrivals, service capacity, and movement rules shape delay and throughput. The template is built to make waiting, blocking, service pressure, and spatial bottlenecks visible fast.
map waiting and service zones clearly
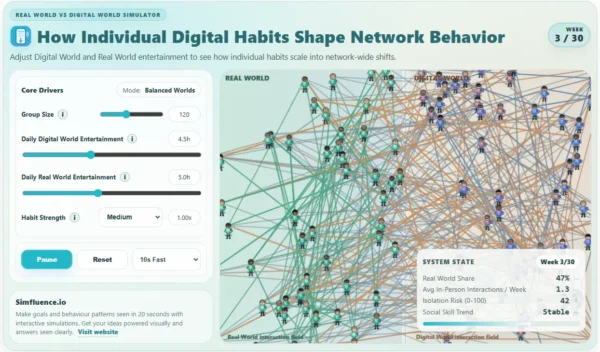
How individual digital habits shape network behavior. Adjust Digital World and Real World entertainment to see how individual habits scale into network-wide shifts — fast enough to feel in ~10 seconds.
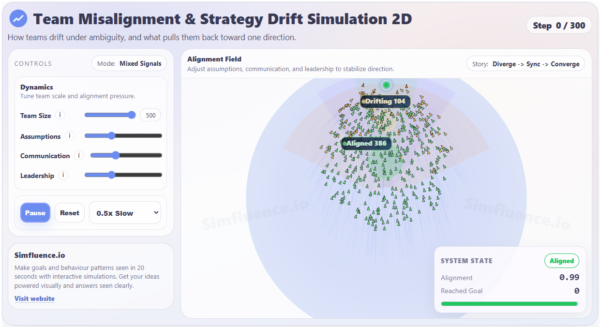
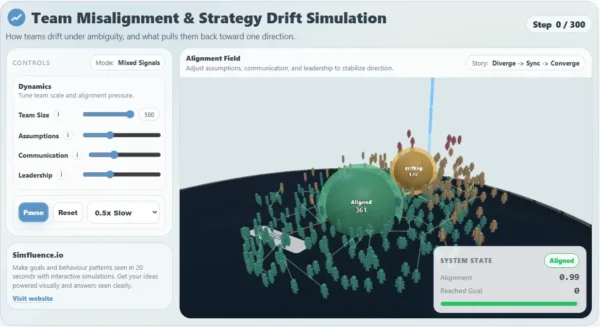
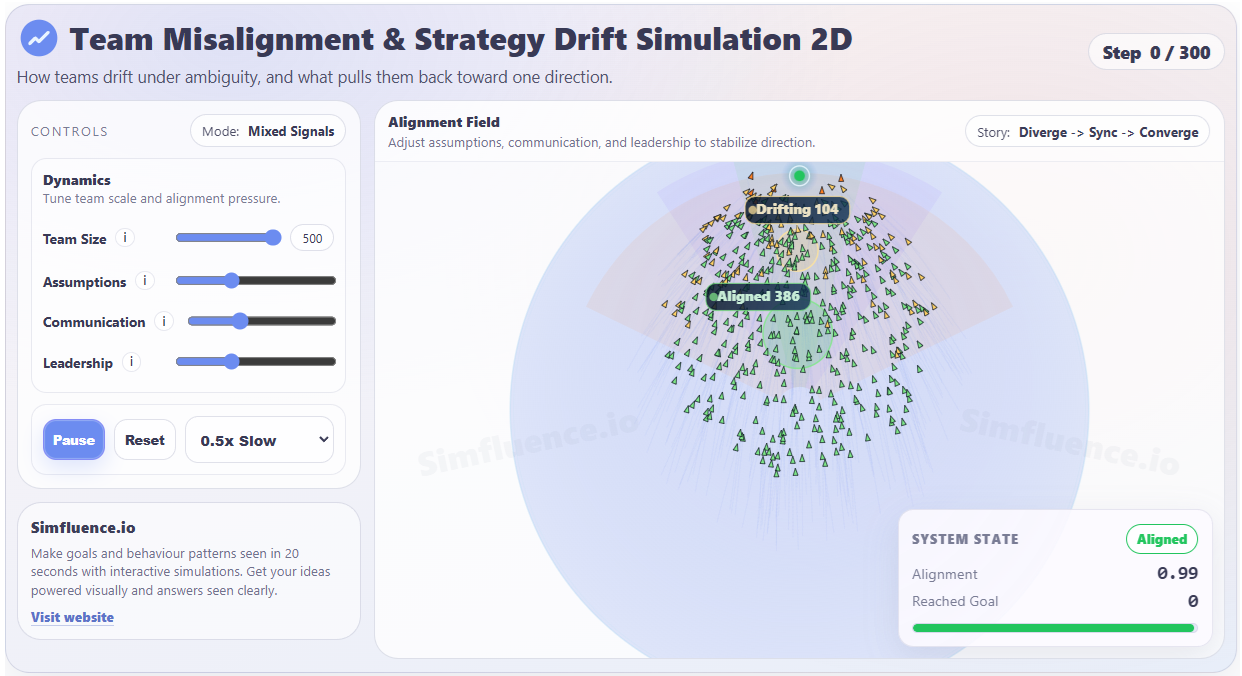
Small assumption gaps compound into visible drift while everyone believes they’re aligned.
Small assumption gaps compound into visible drift while everyone believes they’re aligned.
Demonstrate how distribution yards collapse under peak load — and how DockFlow prevents congestion, SLA penalties, and idle asset costs through intelligent dock orchestration.
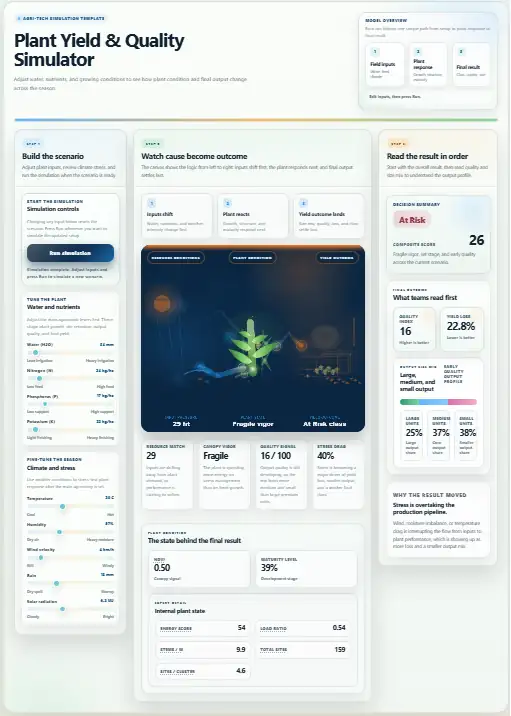
Adjust water, nutrients, and growing conditions to see how plant condition, quality, size mix, and final yield change across the season in one clear interactive simulation.
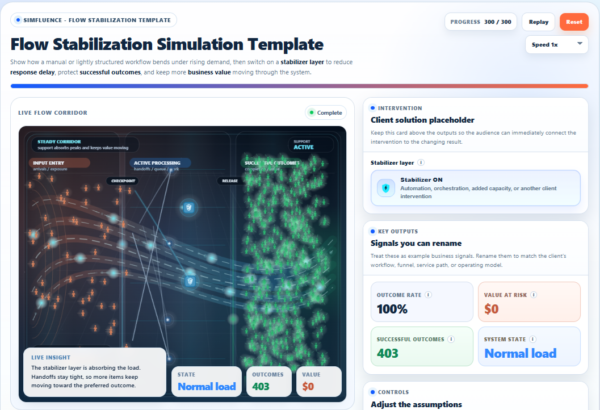
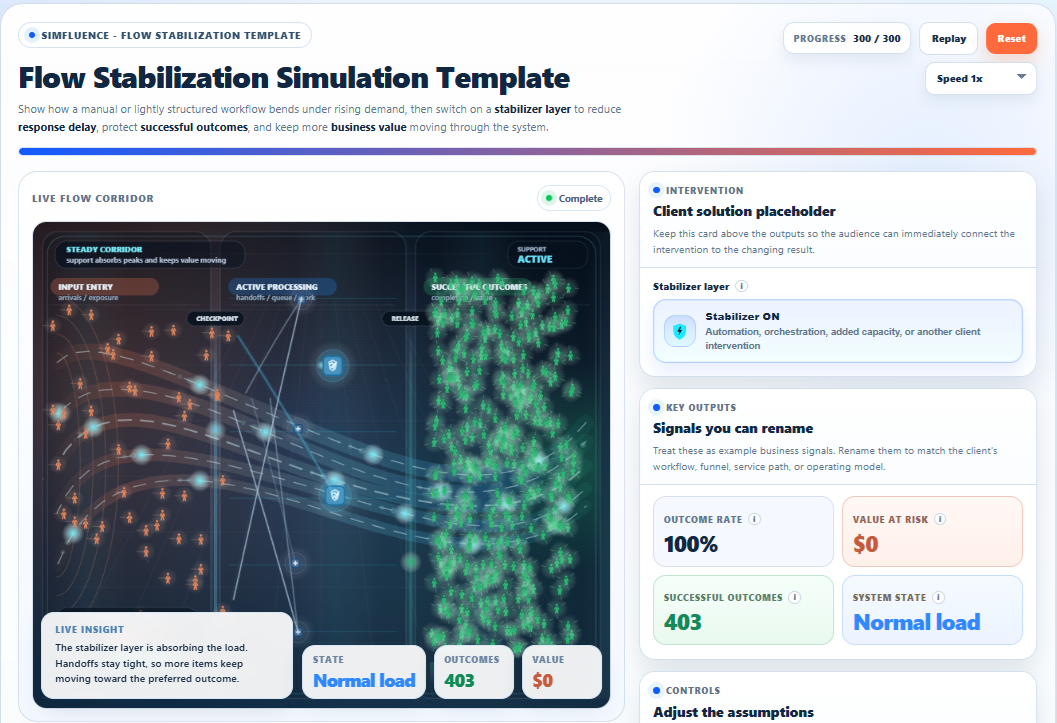
A reusable simulation template that shows how rising demand creates delay, leakage, and workflow strain, and how a stabilizer layer such as automation, orchestration, or added capacity helps protect outcomes and keep business value moving.
