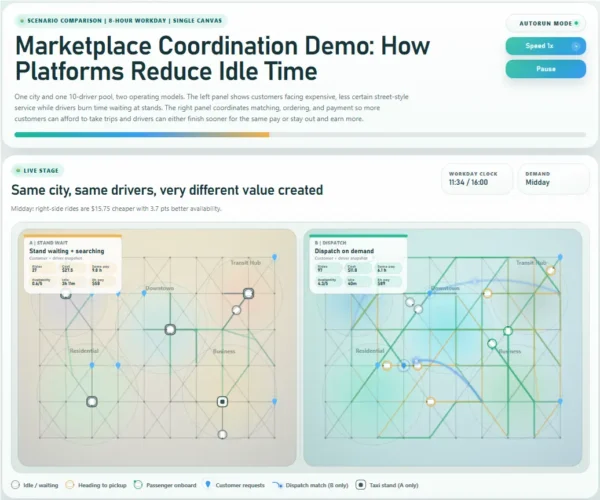
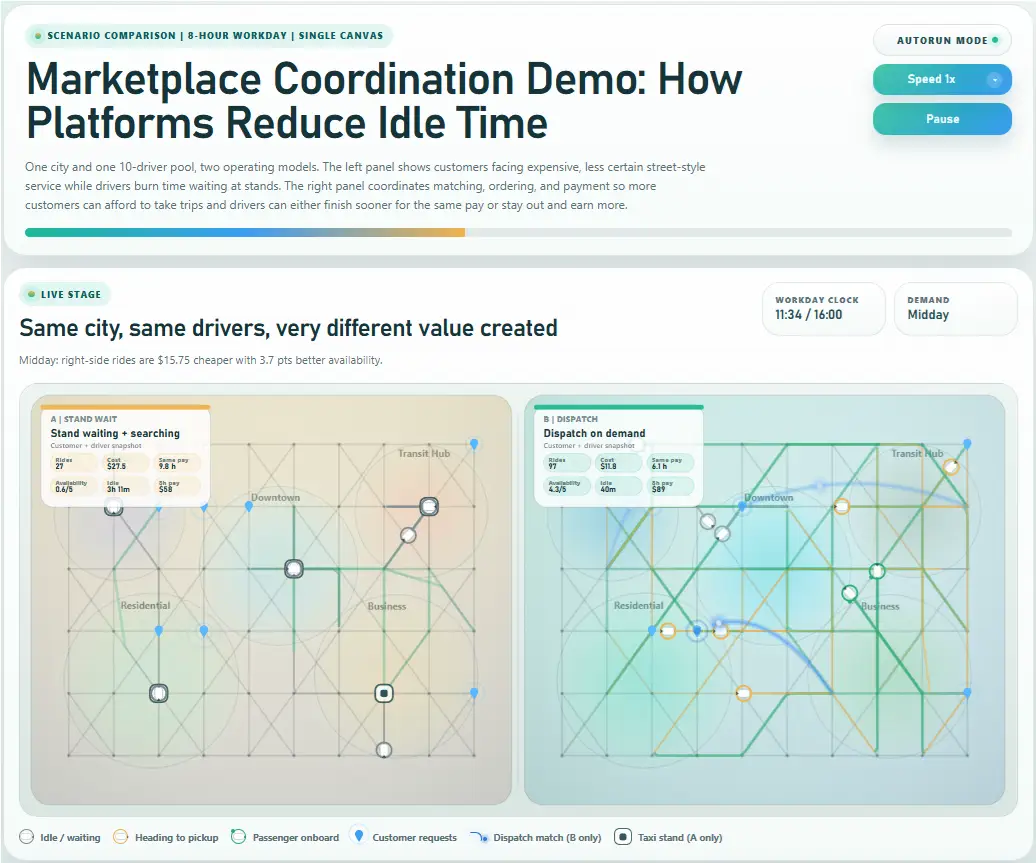
Automated Workflow Time Cost Simulator
Compare manual workflow vs automated workflow for 500-day hours saved, follow-up work, labor cost impact, and queue backlog.
How small control failures silently become audit disasters. Watch missed checks, documentation gaps, and audit timing turn manual work into hidden risk across 500 workdays.
Small errors look harmless day to day, then stack into audit exposure.
Use this stock profit calculator to estimate investment return, net profit, ROI, fees, dividends, taxes, and break-even in one interactive view. Compare buy, current, and predicted outcomes fast.
A single defect enters a production network in both panels. The left side has no lot traceability, so recall scope explodes. The right side isolates only traced batches and contains the blast radius.
One full hour of retail checkout activity, played back at 10x, 25x, 100x, 200x, or 400x speed. Sliders define the scenario before the run; changing any of them restarts the hour from the beginning.
Use this base for ordered multi-stage systems. It fits sales funnels, lead flows, onboarding pipelines, drop-off journeys, approval chains, service handoff paths, and any process where each stage affects final conversion. The template makes stage gates, leakage points, and downstream impact visible fast.
Use this base for linked systems where spread depends on connectivity and thresholds. It fits adoption spread, contagion, referral loops, peer influence, cascading failures, information diffusion, trust propagation, and other network effects where local connections shape global outcomes. The template is built to make saturation, resistance, clustering, and tipping points easy to see.
A 15-second, interactive factory flow simulation that shows how bottlenecks and downtime spread—and how AI coordination restores throughput under real variability.
Shows how product understanding spreads through a market—and why interactive simulations trigger faster adoption than static decks, PDFs, and landing pages. Visualizes threshold-driven cascades, influencer activation, and cross-segment diffusion.
This is the reusable Simfluence base widget. It is designed as a flexible template for many different simulation fields: operations, sales funnels, customer flows, logistics, service systems, workforce allocation, process bottlenecks, and other causal systems. The structure stays stable while the labels, metrics, controls, and logic can be tuned to fit each use case.