compliance • audit exposure • hidden risk
Hidden Compliance Drift Simulation
Small missed checks look harmless day to day. This simulation shows how manual control failures silently accumulate
across 500 workdays, then surface as audit shock, remediation drag, and operational strain.
step 1 — silent drift buildup
step 2 — audit and recovery
stable controls
hidden drift
audit exposure
remediation load
what it shows
How missed checks, bad records, and skipped controls quietly stack up before anyone notices.
Why audit timing matters: weak oversight lets hidden backlog exposure grow faster than teams perceive.
How automated controls reduce both audit shock and the post-audit slowdown caused by remediation.
core controls
team size:number of employees performing checks
checks per day:daily control workload volume
oversight rhythm:tight / balanced / loose audit cadence
replay / reset:rerun the scenario or return to defaults
live outputs
hidden backlog:unseen control failures accumulating over time
audit shock:severity of issues exposed during formal review
operational drag:slowdown after findings, corrective action, and extra oversight
state:stable → drift building → audit hit → recovery
best for
compliance software pages (show hidden backlog risk)
audit readiness decks (why timing and cadence matter)
ops leadership reviews (cost of remediation drag)
buyer demos (manual vs automated control comparison)
compliance drift
audit exposure
hidden backlog
manual controls
automation
oversight cadence
remediation
risk accumulation
operations
audit shock
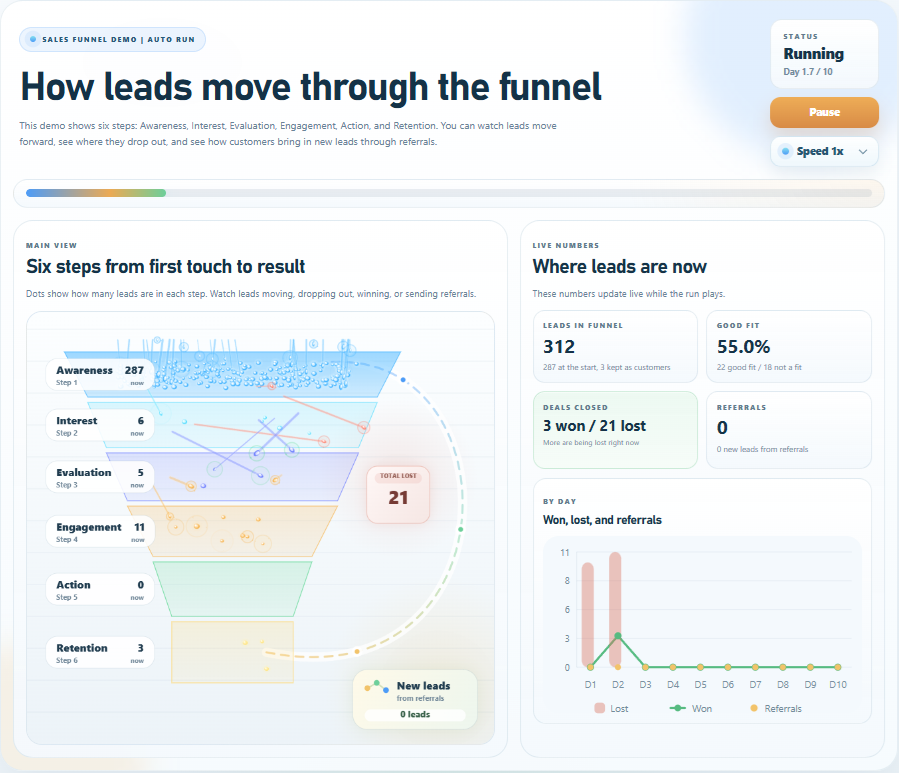
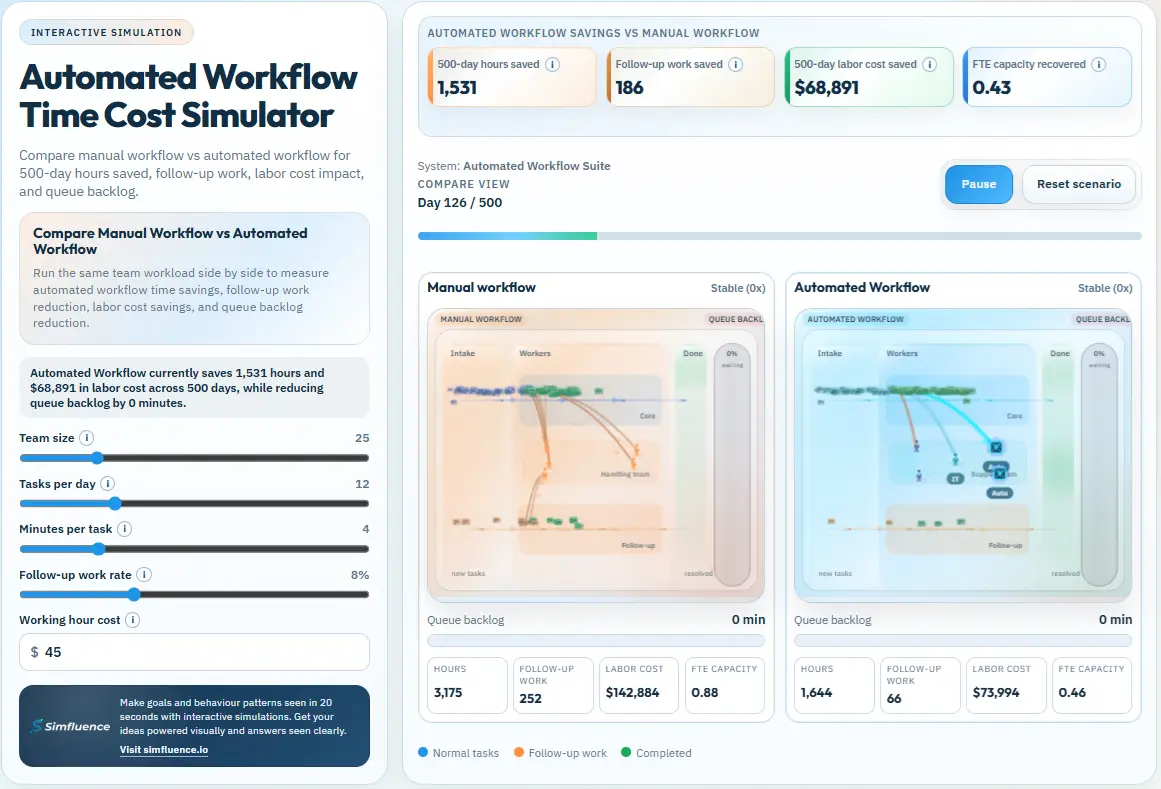
The simulation compares manual process versus automated control system over 500 workdays.
Small failures accumulate quietly, then a formal audit exposes the gap. After that, remediation slows operations —
and the manual side usually takes the harder punch.