Skip to content
Simfluence Simulations
  • Home
  • Simulations
  • Blog
  • Solutions
Contact us

Customer Flow Simulation

conversion flow canvas • autorun funnel demo • particle-based journey

Customer Funnel Simulation | Conversion Flow Canvas

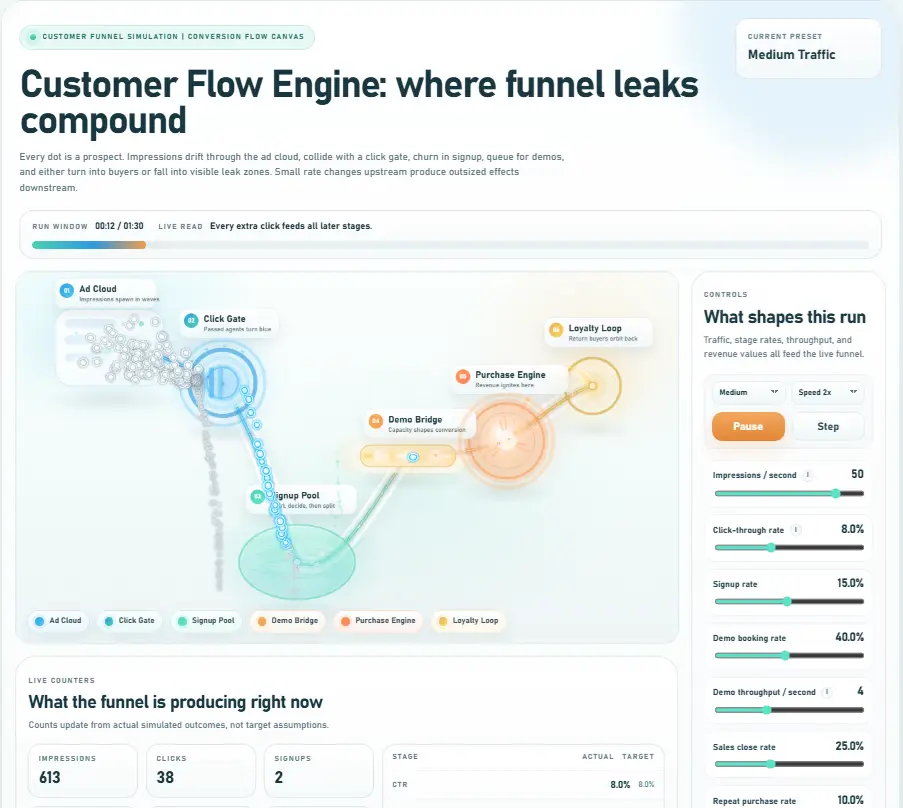
Every dot is a prospect. Impressions drift through the ad cloud, collide with a click gate, churn in signup, queue at the demo bridge, and either become buyers inside the purchase engine or fall into visible leak zones. The core message is simple: small upstream rate changes compound into outsized downstream revenue effects.
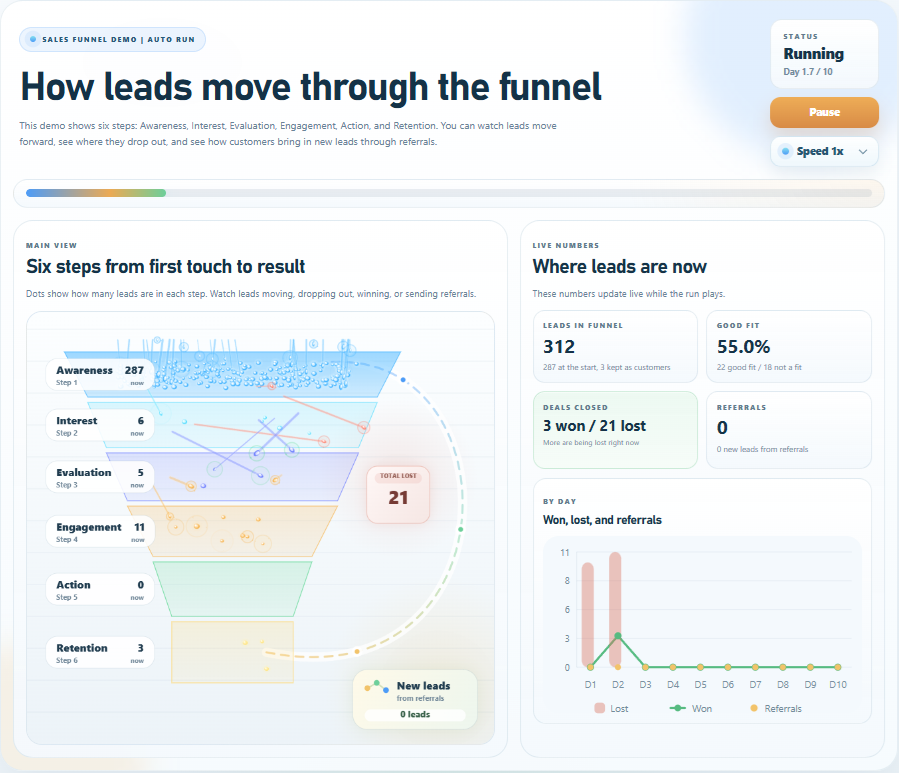
step 1 — watch prospects move through the funnel live step 2 — see where leaks compound and revenue dies
traffic flow conversion / purchase events leak zones / bottlenecks run window progress
what it shows
How impressions move through the full funnel: ad cloud → click gate → signup pool → demo bridge → purchase engine → loyalty loop.
How funnel leaks compound: most future buyers can die early even when later-stage close rates look healthy.
How traffic, stage rates, throughput, and order values translate into live counts, visible queues, and simulated revenue.
core scenes
ad cloud:impressions enter the system as moving particles
click gate:the current bottleneck where most traffic is leaking
signup + demo:prospects churn, queue, or clear into real sessions
purchase engine:buyers form and revenue starts to appear
loyalty loop:repeat purchases reveal downstream retention value
live outputs
live counters:impressions, clicks, signups, demo bookings, purchases, repeat purchases, revenue
stage table:actual versus target for CTR, signup, demo booking, close, and repeat rate
interpretation cards:current bottleneck, demo pressure, revenue per 1000 impressions, repeat revenue share
leak stack:click misses, signup exits, demo drop-offs, purchase dissolves, loyalty churn
best for
marketing funnel and conversion optimization pages
sales pipeline explainers and RevOps storytelling
SaaS landing pages, decks, and buyer education
customer acquisition, CAC efficiency, and retention messaging
customer funnel simulation conversion flow canvas funnel leak visualization click-through rate signup conversion demo booking sales close rate repeat purchase revenue per 1000 impressions particle funnel demo
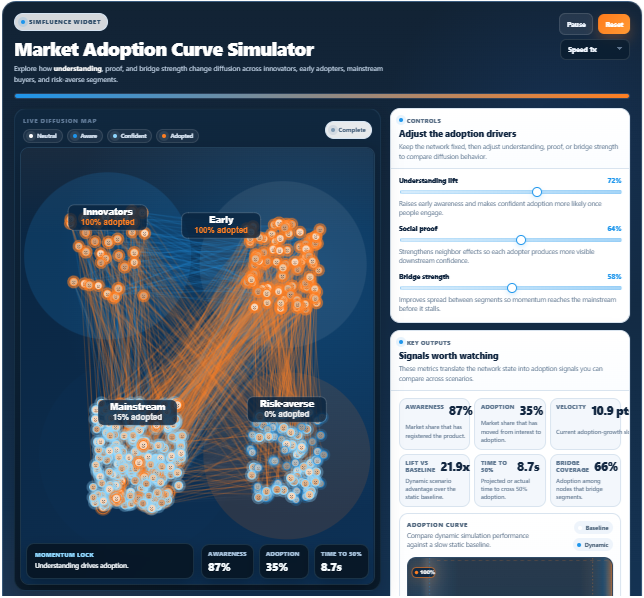
This simulation makes one core growth truth visible: the funnel does not fail in one place only — tiny frictions early in the journey compound into large downstream revenue loss. What looks like a click problem becomes a signup problem, then a demo problem, then a purchase problem.
Open simulation → Request a quote →
Preview
Customer Funnel Simulation | Conversion Flow Canvas preview
what users watch A short autorun particle funnel where every moving dot is a prospect. Users can see traffic enter, convert, queue, leak, buy, and sometimes loop back into repeat revenue.
headline mid-run moment The live read shows that most traffic is leaking at the click gate, meaning future revenue is being destroyed before prospects even reach serious engagement.
live example snapshot In the current sample run the funnel has produced 3060 impressions, 234 clicks, 31 signups, 13 demo bookings, 3 purchases, 1 repeat purchase, and $4140 revenue.
interpretation layer The widget turns motion into business language with cards for current bottleneck, demo bridge pressure, revenue per 1000 impressions, and repeat revenue share.
leak stack message Visible loss zones roll up into counters such as 2689 click gate misses, 178 signup exits, 18 demo queue drop-offs, 9 purchase dissolves, and 2 loyalty loop churn events.
  • Efficiency & Operations
  • Revenue & Growth
  • b2b sales funnel stages
  • Click-Through Rate (CTR)
  • Conversion Flow Analysis
  • Conversion Funnel Visualization
  • Customer Journey Simulation
  • Demo Booking Conversion
  • Flow Analysis
  • Funnel Drop-Off Analysis
  • Funnel Dynamics
  • Funnel Particle Simulation
  • Interactive Simulation and Explainer Tool
  • Lead Flow Simulation
  • Lead Generation Spikes
  • Pipeline Movement Visualization
  • Referral Loop Simulation
  • Sales Close Rate
  • sales funnel
  • sales funnel management
  • sales funnel process
  • sales funnel process steps
  • Sales Funnel Simulation
  • sales funnel strategy
  • Signup Conversion Rate

Explore more simulations & explainers

Agri-tech plant yield and quality simulation showing how water, nutrients, and climate conditions affect crop outcome

Agri-tech Simulation Template: Plant Yield & Quality Simulator

ROI graphic showing cost, revenue, break-even point, and profit growth over time

ROI Calculator: Payback, Break-Even, and Profit Over Time

Interactive market adoption simulator that shows how understanding, social proof, and bridge strength shape diffusion across innovators, early adopters, mainstream buyers, and risk-averse segments.

Product Adoption Curve Examples: Stages Simulator

Scenario Comparison Template for Baseline vs Improved Process

Scenario Comparison

Revenue Stabilization Simulation (Sales Pipeline Collapse Under Spikes)

Revenue Stabilization Simulation | Prevent Sales Pipeline Collapse

Sales funnel management helps to optimize sales funnel

Sales Funnel Stages

Customer Flow Simulation – Visualizing Customer Journeys

Customer Flow Simulation

Marketplace Coordination Demo - How Platforms Reduce Idle Time

Platform Coordination Simulator: How Marketplaces Reduce Idle Time and Increase Efficiency

The Doomscrolling Effect: Brainrot Habit Simulation

The Doomscrolling Effect: Brainrot Habit Simulation

How AI may change work This widget shows one simple idea: AI may be able to do many tasks, but companies adopt it slowly. As the sim runs, you can see how that delay may affect some jobs, new hiring, and other work signals. It is a simple demo, not a prediction.

How AI may change work

Automated Workflow Time Cost Simulator Compare manual workflow vs automated workflow for 500-day hours saved, follow-up work, labor cost impact, and queue backlog.

Automated Workflow Time Cost Simulator

Compliance Drift Simulator - Shows how small missed checks, documentation gaps, and delayed oversight quietly accumulate into audit exposure, remediation burden, and operational disruption across 500 workdays.

Compliance Drift Simulator

View Simulation Samples
Simfluence Simulations
Simfluence creates interactive tools and widgets for product explainers, scenario simulations, what-if analysis, workflow and funnel visualization, and system and behavior modeling.

Company

  • Simulations
  • Blog
  • Solutions
  • Contact

Follow us

Facebook
Twitter
Youtube

Connect

Email - WhatsApp - Teams
contact@simfluence.io

© Copyright 2022 Dream-Theme. All rights reserved.

Privacy policy
Terms & conditions
Go to Top
  • Home
  • Simulations
  • Blog
  • Solutions
Contact us
free offer

Get 3 simulation ideas tailored for your business

Not sure what simulations would work for you? No worries. We analyze your business and send you three concrete simulation ideas tailored to your business.

The e-mail includes: .

  • ✓3 simulation concepts with detailed benefits
  • ✓Suggested metrics to visualize
  • ✓Examples how to use the simulations in your case
The email is FREE for you. It is meant to visualize some simulation options you have. Futher commitment from your side is NOT NEEDED.