Queues • Bottlenecks • Retail self-service
Throughput & Capacity — Retail Self-Service Checkout Simulation
One full hour of checkout activity is simulated and played back at 10×–400× speed.
You set the scenario with sliders (preference, kiosks, cashiers, assistants, demand). Any change restarts the hour so the outcome is comparable.
Step 1 — Set scenario
Step 2 — Run 1 hour (fast playback)
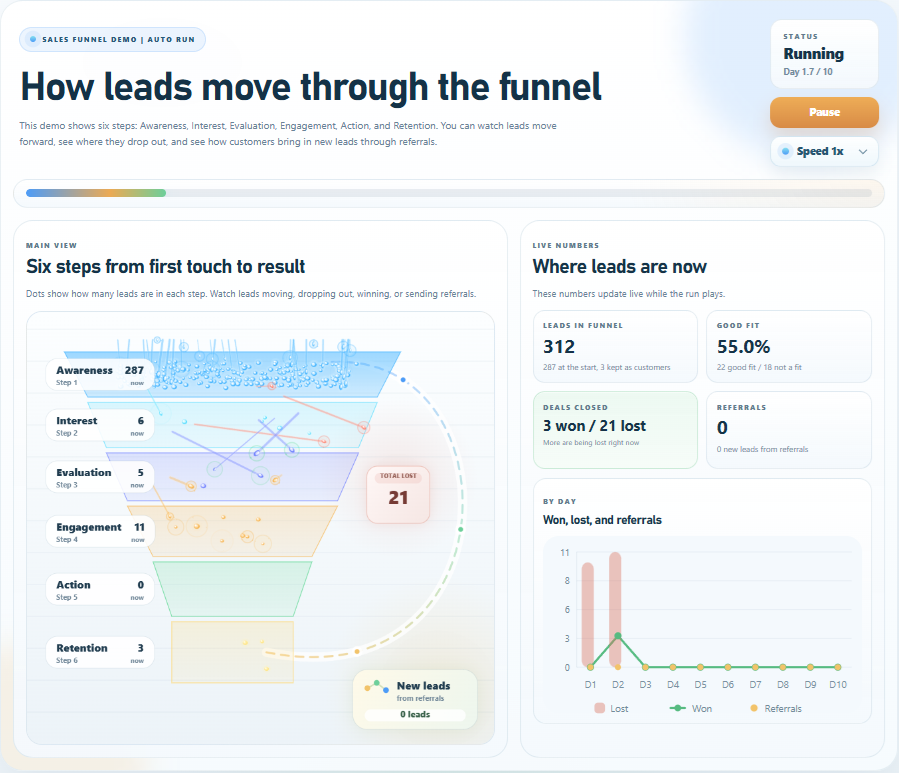
What it shows
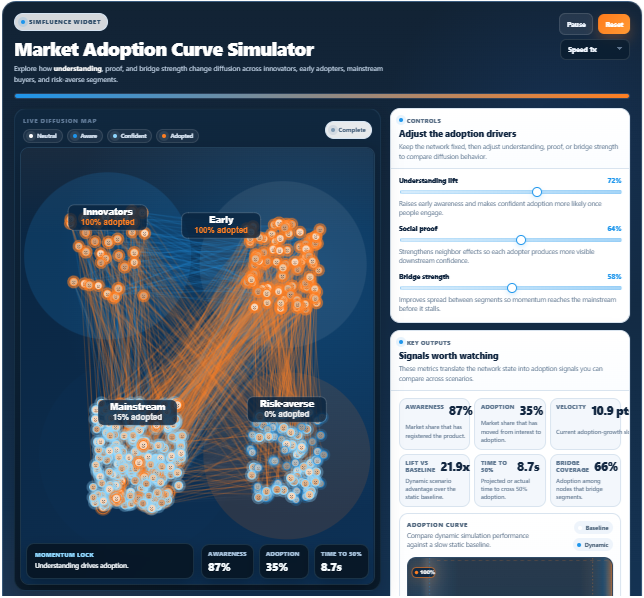
How small capacity mismatches turn into queues and bottlenecks across lanes.
Why “more kiosks” isn’t always the fix: assistance capacity and error handling can become the real choke point.
How demand (clients/hour) interacts with lane choice (self-service preference) to change wait times and served volume.
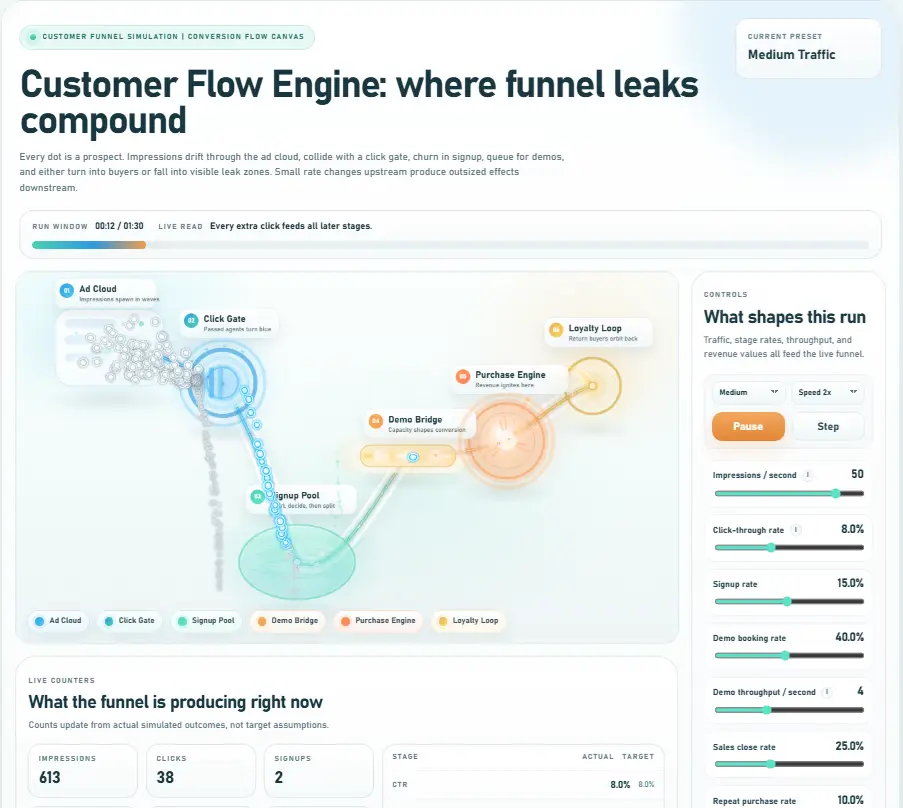
Core controls
Speed:10×, 25×, 100×, 200×, 400× playback
Demand:Clients per hour
Preference:% choosing self-service
Capacity:# kiosks, # cashiers, # assistants
Restart:Any slider change restarts the hour
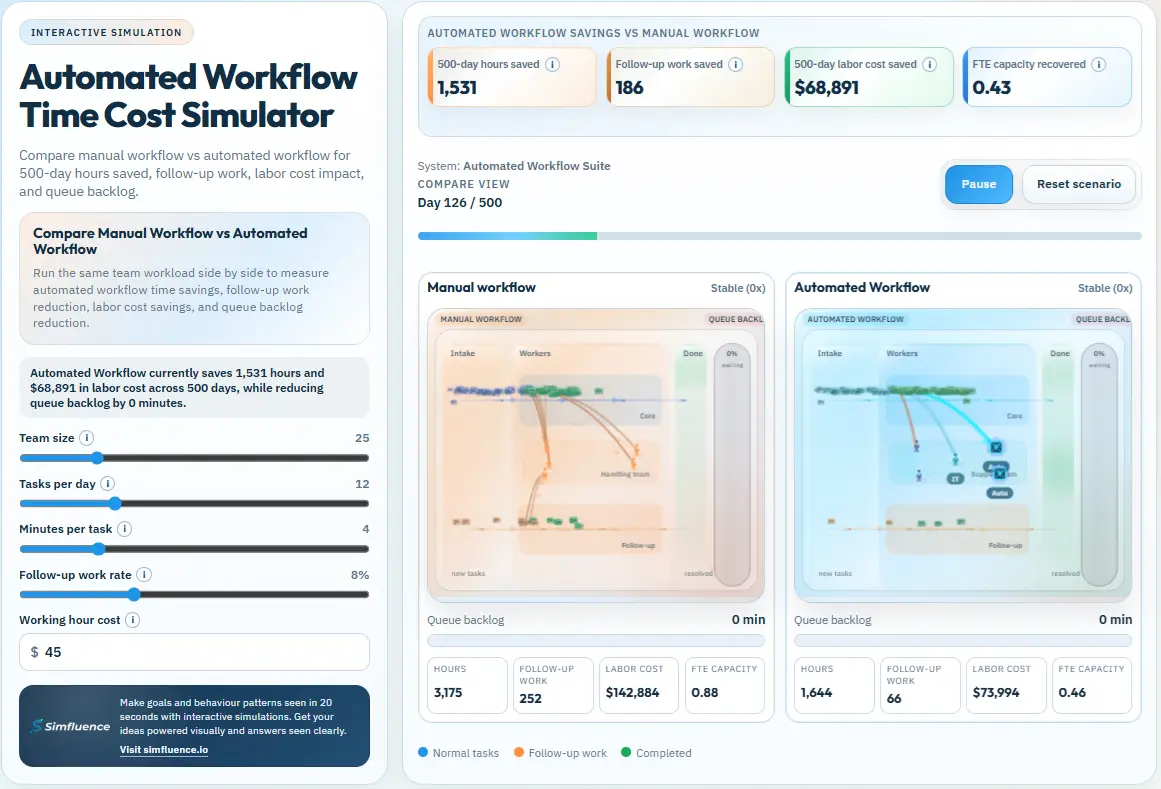
Live outputs
Wait now:Traditional vs Self-Service (seconds)
Served by clock:Total served so far (count)
Queue pressure:Index (light → heavy) + flow state
Utilization:% busy for cashiers, kiosks, assistants
Completions:Traditional vs Self-Service by 60:00
Best for
Retail staffing & scheduling pages (make tradeoffs visual)
Self-checkout proposals (capacity planning narrative)
Ops workshops (stress-test demand spikes)
Exec decks (show “balanced flow” vs “system strain”)
queues
bottlenecks
throughput
capacity planning
utilization
wait times
self-checkout
staffing
kiosk errors
assist capacity
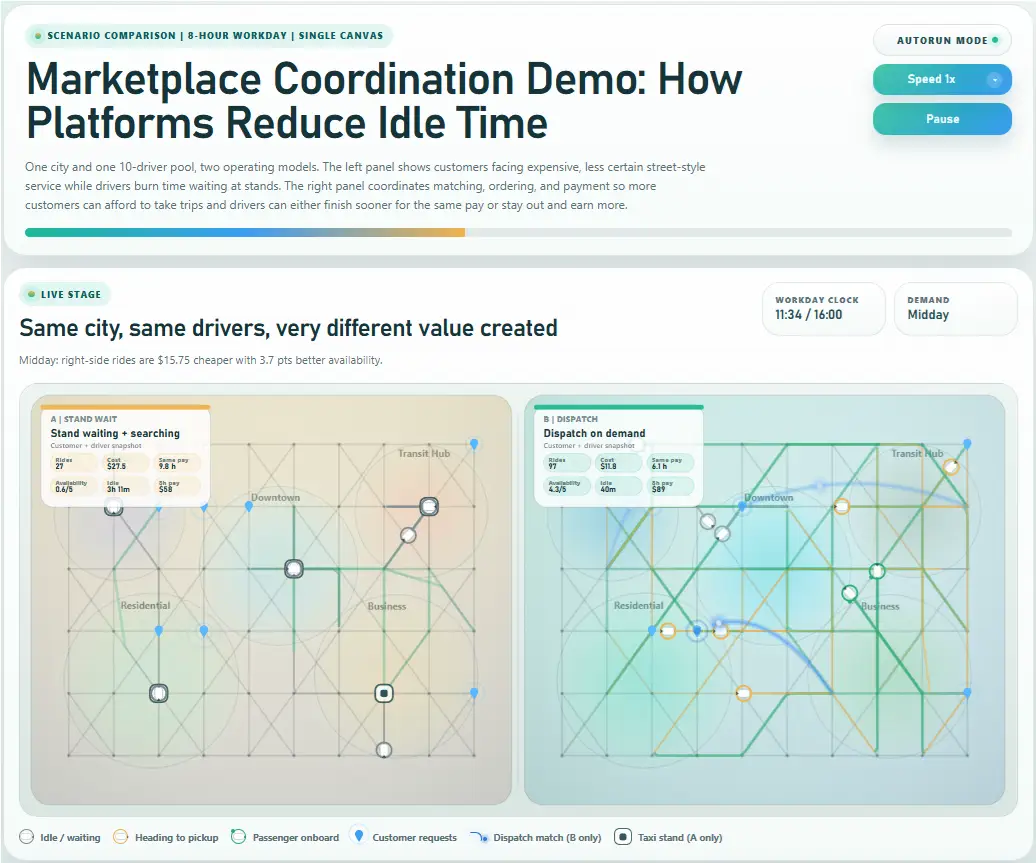
Dial demand and capacity until the system flips from balanced flow to queue pressure.
The point isn’t a single “right” staffing number — it’s showing the shape of the tradeoff.
- Capacity Planning Simulation
- Interactive Simulation and Explainer Tool
- Process Bottleneck Simulation
- Process Throughput Simulation
- Queue Management Systems
- Resource Utilization Simulation
- Self-Checkout Simulation
- Self-Service Kiosk Errors
- Support Capacity Simulation
- Wait Time Simulation
- Workforce Staffing Simulation