public safety demo • crime forecasting map • patrol planning support
Crime Forecasting Map Demo
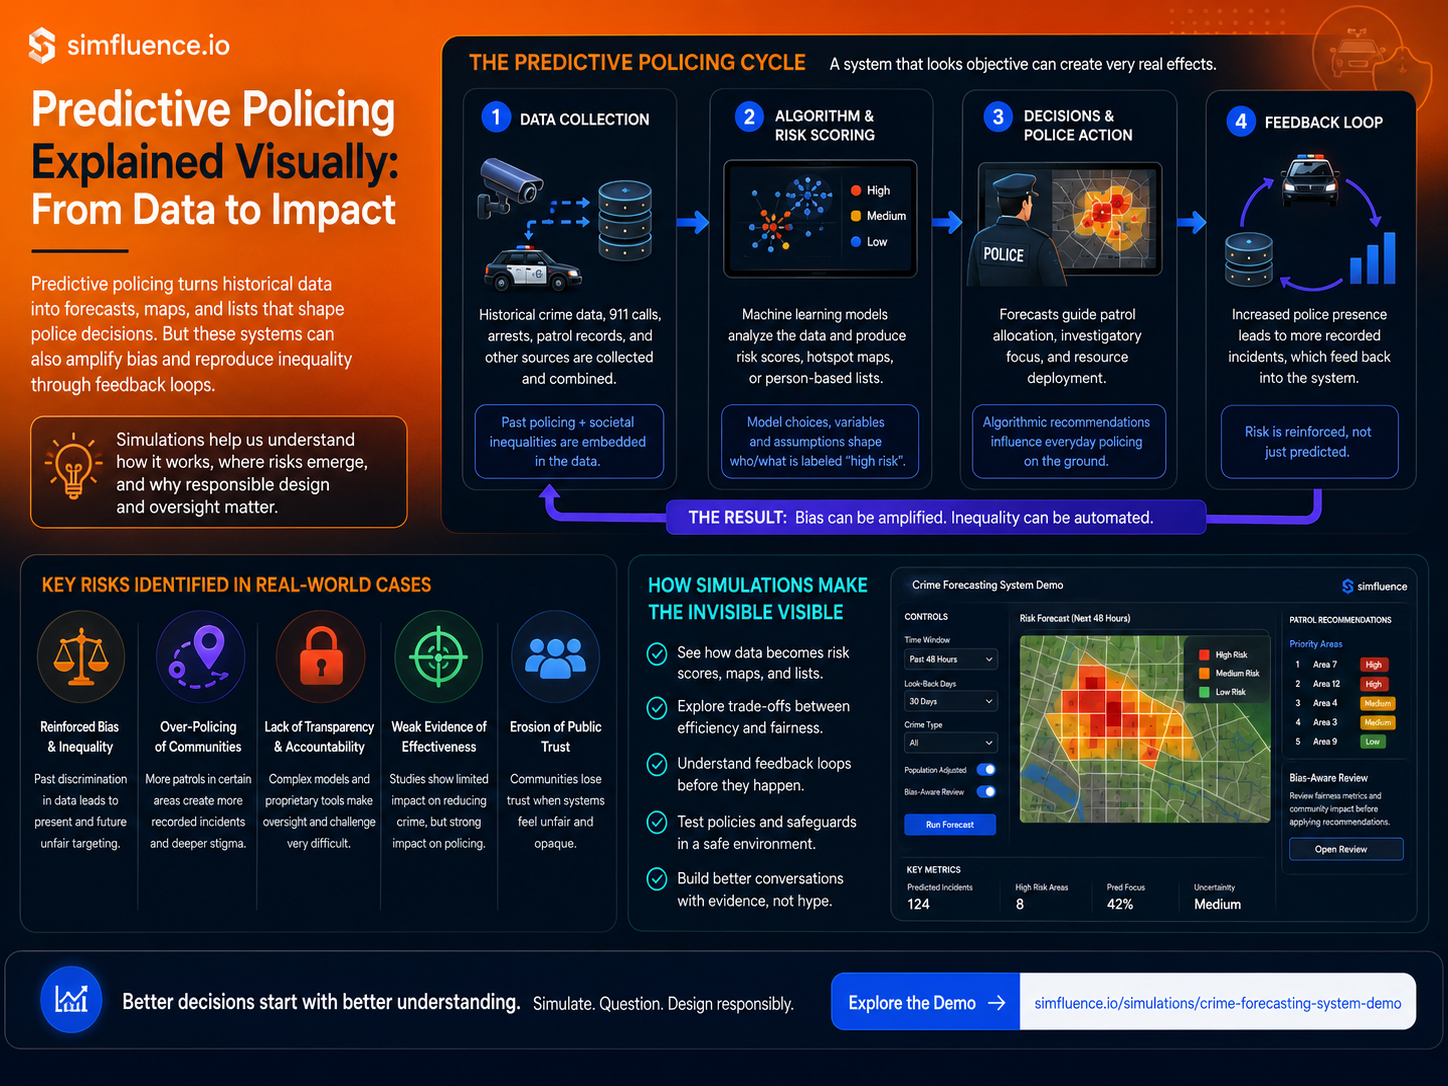
Preview how a 48-hour crime forecast becomes sample patrol guidance in one simple public safety demo.
This synthetic crime risk map shows how sample incident forecasts, population-adjusted exposure,
area rankings, and risk scores can support patrol planning, operational review, and bias-aware decision support.
Users can inspect a sample area, run the 48-hour outlook, and see how predicted incidents translate into practical public safety guidance.
step 1 — explore the synthetic crime forecast map and selected area profile
step 2 — run the 48-hour forecast and review sample patrol guidance
predicted incidents
risk score
selected sample area
48-hour patrol outlook
what it shows
How a synthetic public safety forecast turns sample data into risk scores, area rankings, and patrol planning signals.
How risk scoring blends forecasted incidents with population-adjusted exposure, local context, and time-based patterns.
Where AI system risks, confidence levels, and bias-aware review points need to be visible before operational use.
main view
map demo:synthetic crime risk map with sample area selection
decision support:48-hour forecast converted into sample patrol guidance
area context:population, density, foot traffic, area type, nightlife, and student indicators
review tools:open dataset, methodology note, 48-hour patrol plan, and risk explanation
sample outputs
selected area:Highview Estate, residential area with medium foot traffic
risk score:6/10, with a 1/10 low to 10/10 critical scale
48-hour peak:0.91 predicted incidents at Sat 19:00
suggested action:targeted patrol pass for the active forecast hour
best for
public safety AI demos, police analytics explainers, and civic technology education pages
showing how forecasting tools can support patrol planning without hiding uncertainty or risk
training teams, students, policymakers, and communities to question automated public safety systems
explaining prediction limits, population exposure, confidence levels, and bias-aware review points
crime forecasting map
public safety AI demo
predictive policing simulation
patrol planning demo
crime risk map
synthetic public safety dataset
AI system risks
bias-aware review
forecast confidence
population-adjusted exposure
This demo makes one thing visible fast:
crime forecasting is not just a map problem — it is a decision-support problem involving data assumptions,
population exposure, uncertainty, operational judgment, and bias-aware review before any patrol guidance is trusted.
Related blog post
Predictive policing simulation explainer
How Simulations Make Predictive Policing Easier to Understand
Predictive policing is difficult to explain because its risks are not only technical. This article shows how simulations make feedback loops, biased data, risk scoring, over-policing, and algorithmic decision-making easier to see and discuss.