
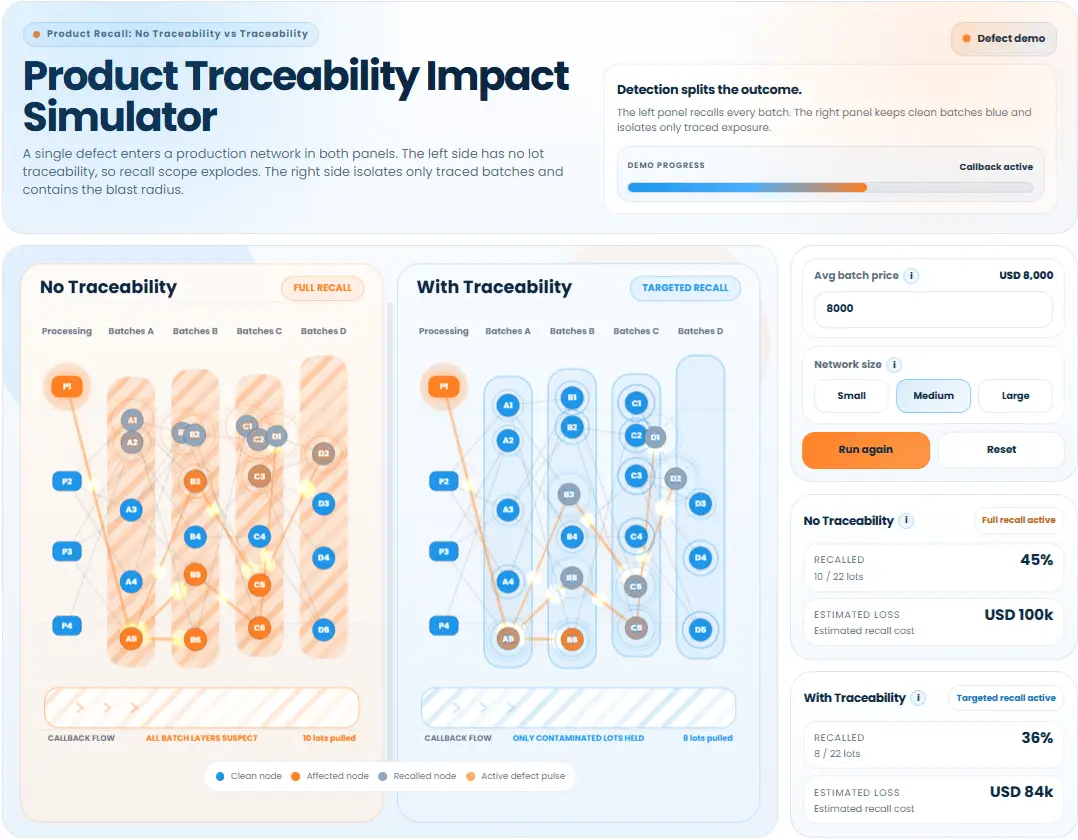
Product Recall — No Traceability vs Traceability
A single defect enters a production network in both panels. The left side has no lot traceability, so recall scope explodes. The right side isolates only traced batches and contains the blast radius.
Interactive simulation and explainer tools that help users explore systems, test scenarios, and understand how outcomes change in real time. Ideal for product demos, decision support, and explaining complex processes clearly.
A single defect enters a production network in both panels. The left side has no lot traceability, so recall scope explodes. The right side isolates only traced batches and contains the blast radius.
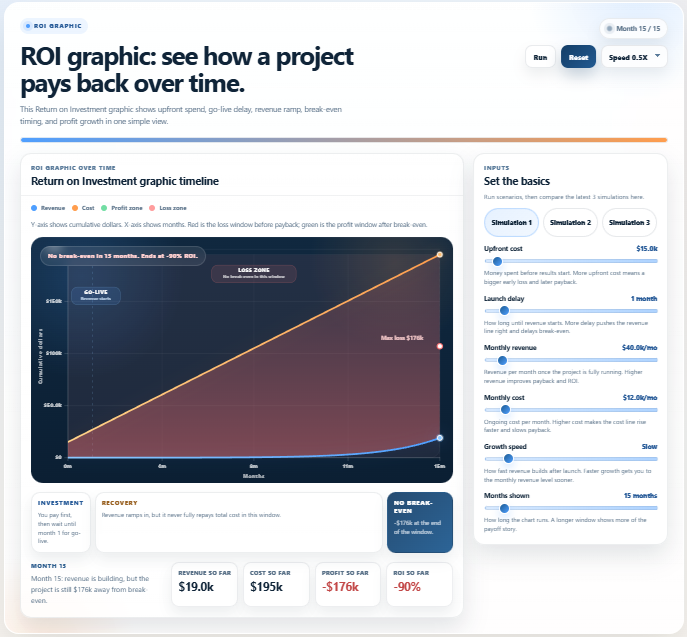
An interactive ROI calculator that shows how a project pays back over time. See upfront cost, launch delay, revenue growth, break-even timing, and profit growth in one view. The simulation makes return on investment over time easier to understand than a static chart.
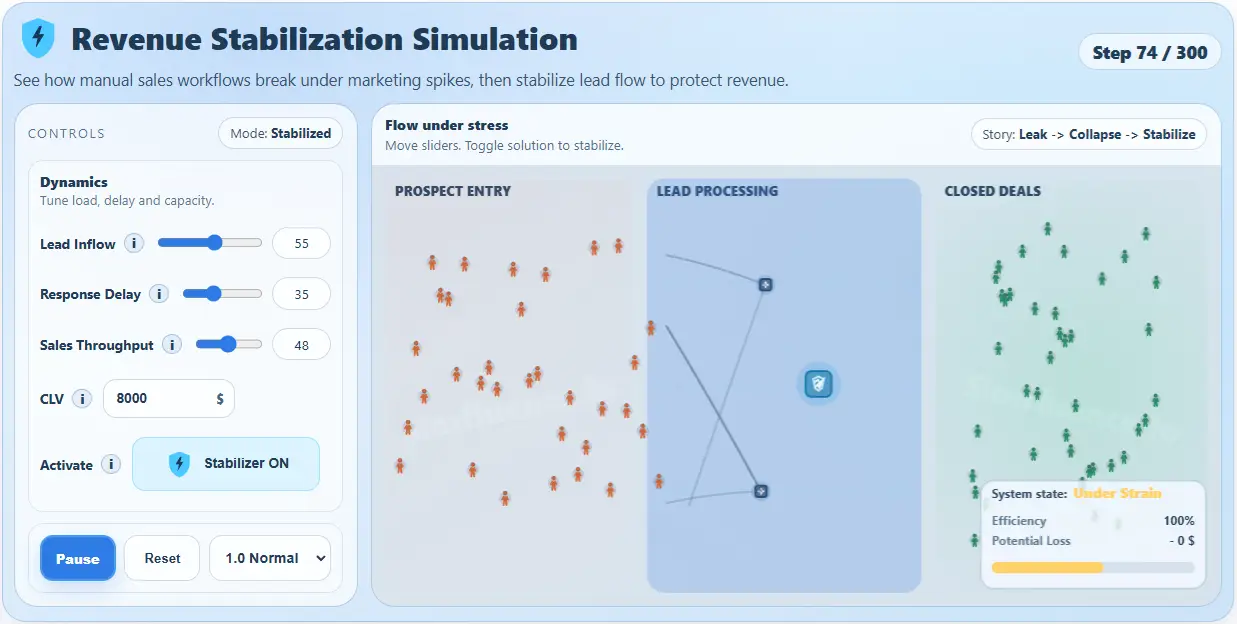
Make revenue leakage visible in under 20 seconds. This interactive widget shows how manual sales workflows collapse under inbound spikes — and how FlowGuard AI stabilises lead flow with fast routing, instant booking, and smarter qualification.
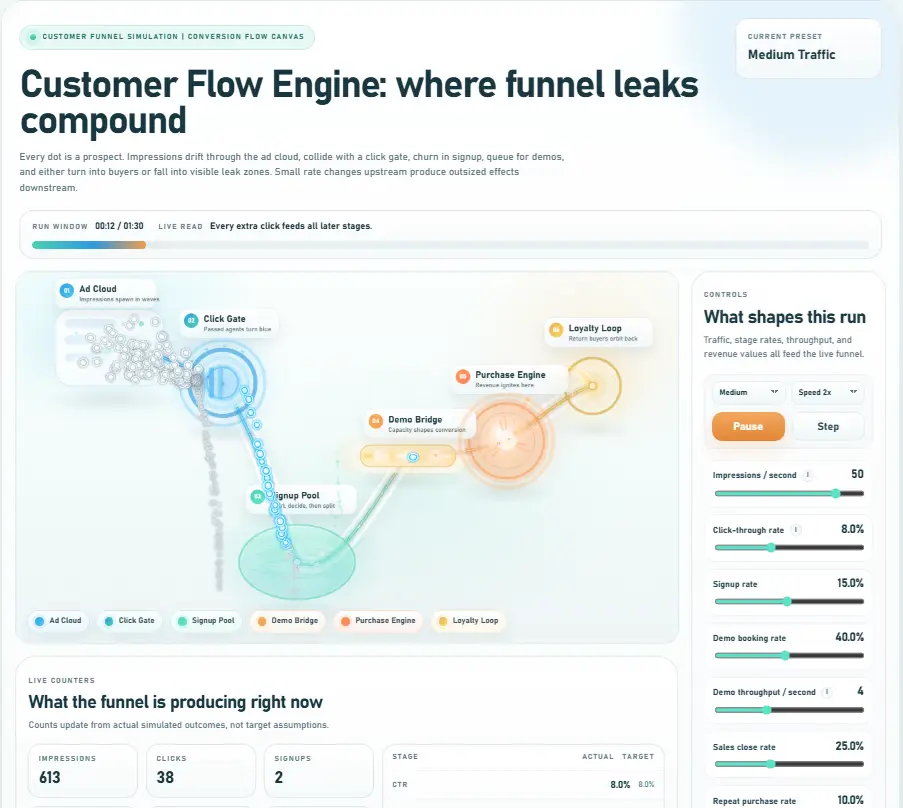
Customer flow models visualize how people enter a system, progress through stages such as awareness, sign-up or purchase, and eventually convert or drop off. By simulating these dynamics, organizations can identify bottlenecks, friction points and conversion opportunities across the customer journey.
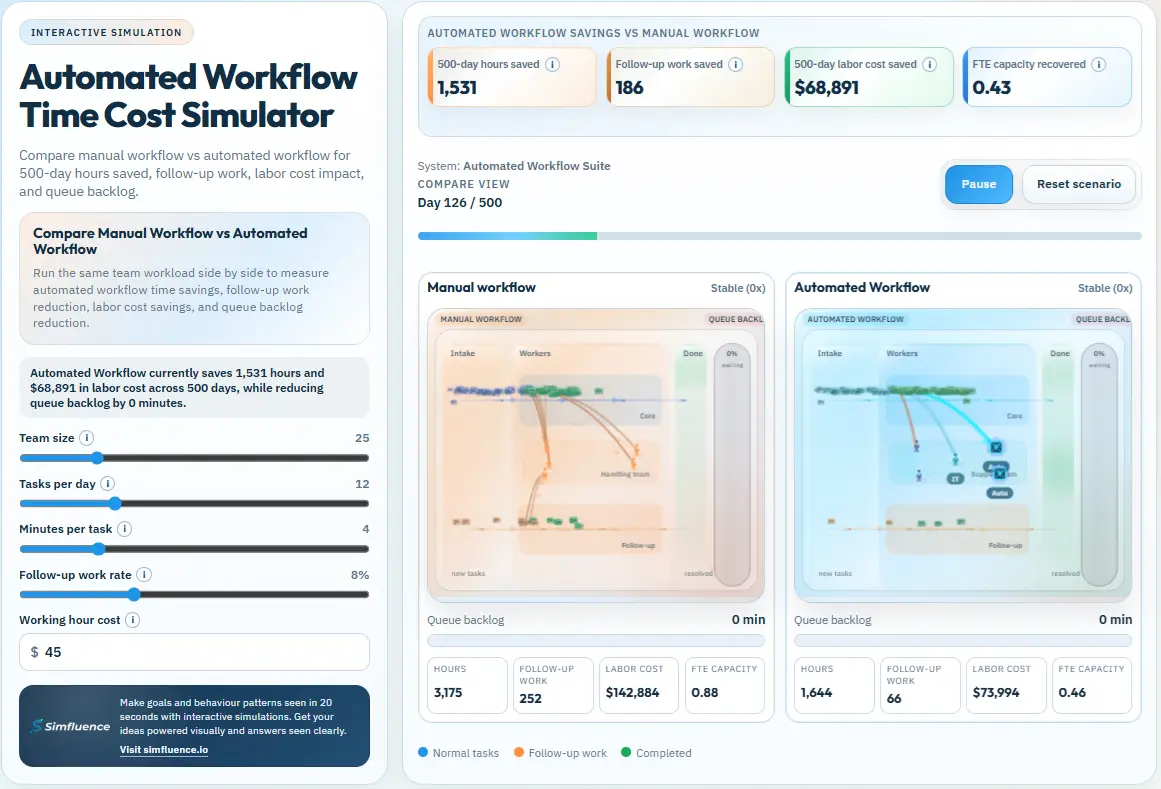
Compare manual workflow vs automated workflow for 500-day hours saved, follow-up work, labor cost impact, and queue backlog.
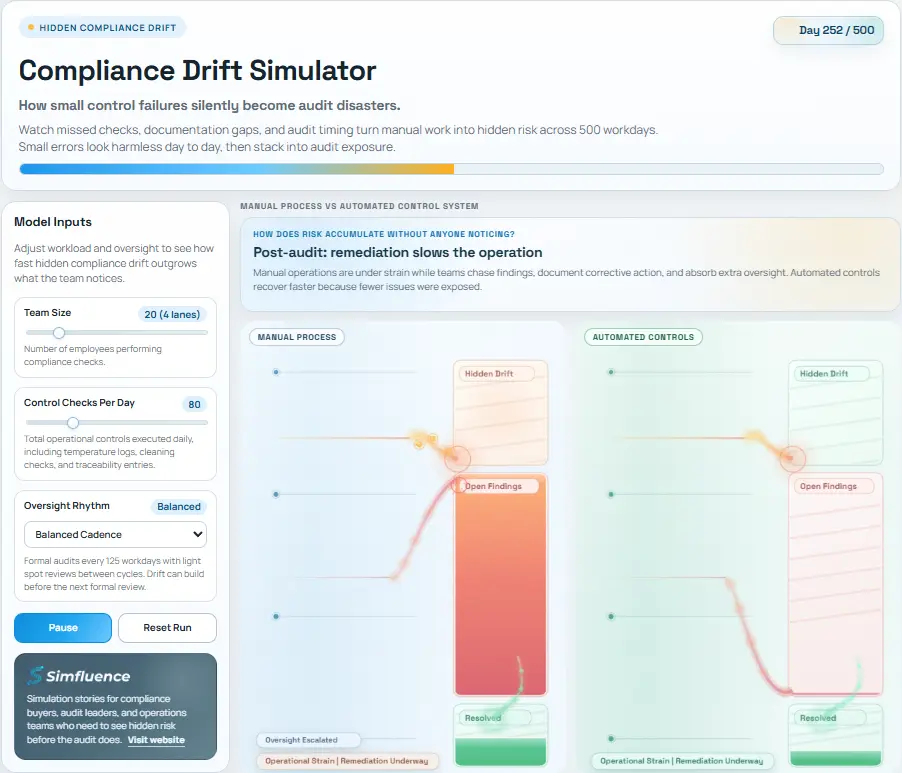
How small control failures silently become audit disasters. Watch missed checks, documentation gaps, and audit timing turn manual work into hidden risk across 500 workdays.
Small errors look harmless day to day, then stack into audit exposure.
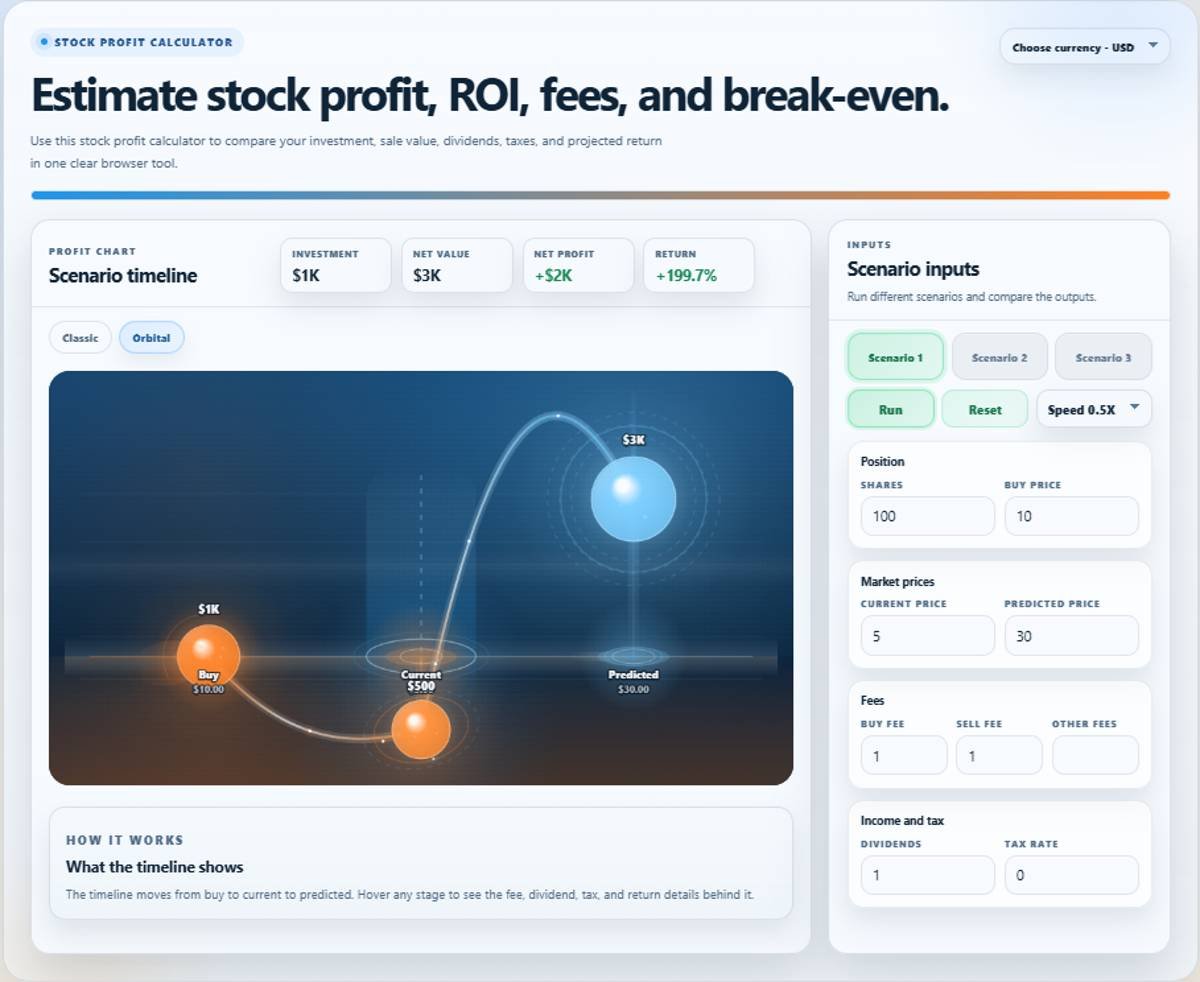
Use this stock profit calculator to estimate investment return, net profit, ROI, fees, dividends, taxes, and break-even in one interactive view. Compare buy, current, and predicted outcomes fast.
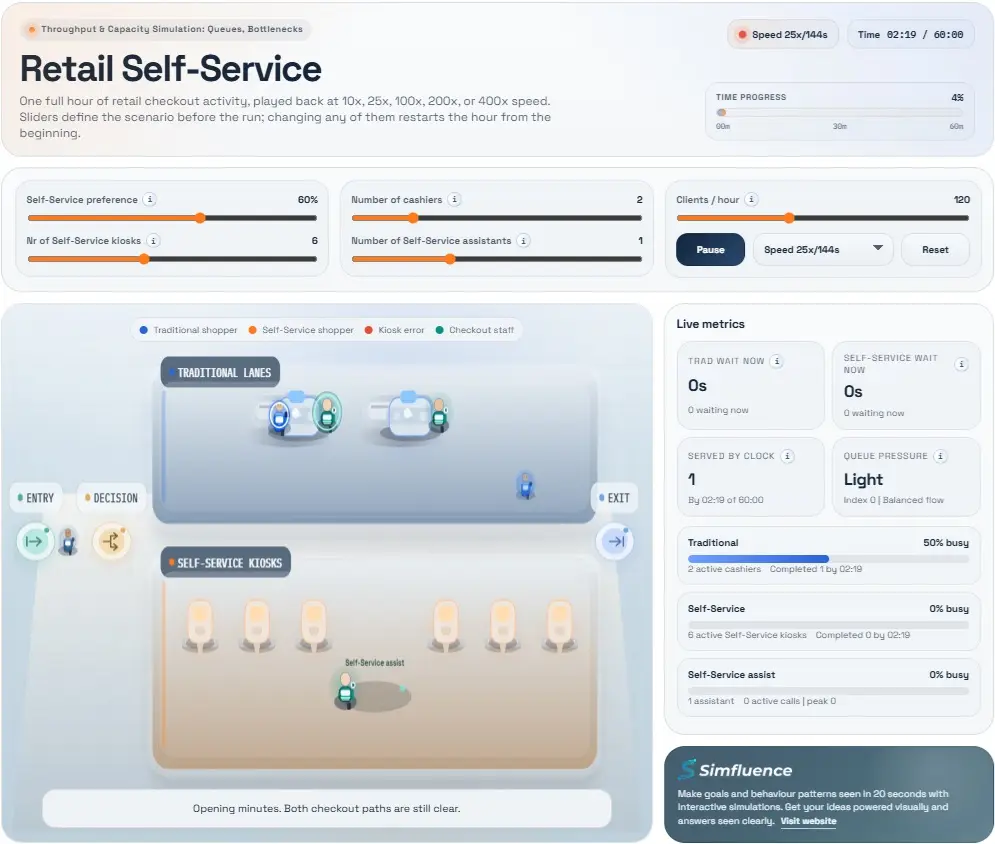
One full hour of retail checkout activity, played back at 10x, 25x, 100x, 200x, or 400x speed. Sliders define the scenario before the run; changing any of them restarts the hour from the beginning.
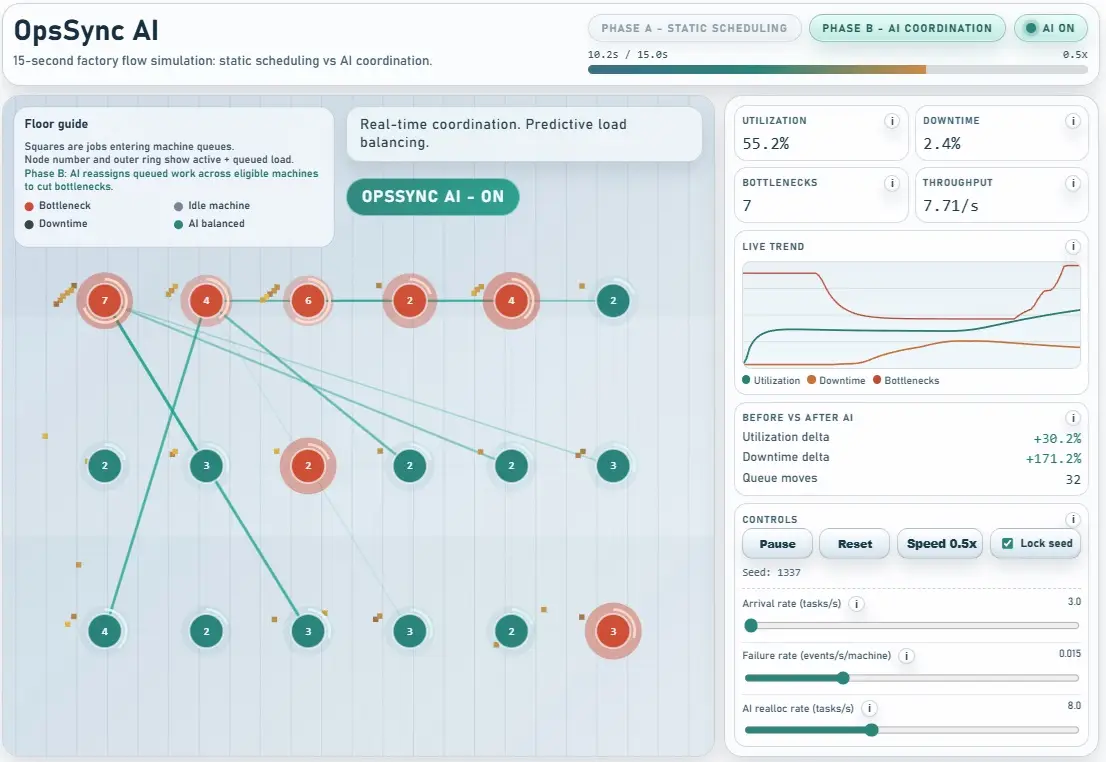
A 15-second, interactive factory flow simulation that shows how bottlenecks and downtime spread—and how AI coordination restores throughput under real variability.
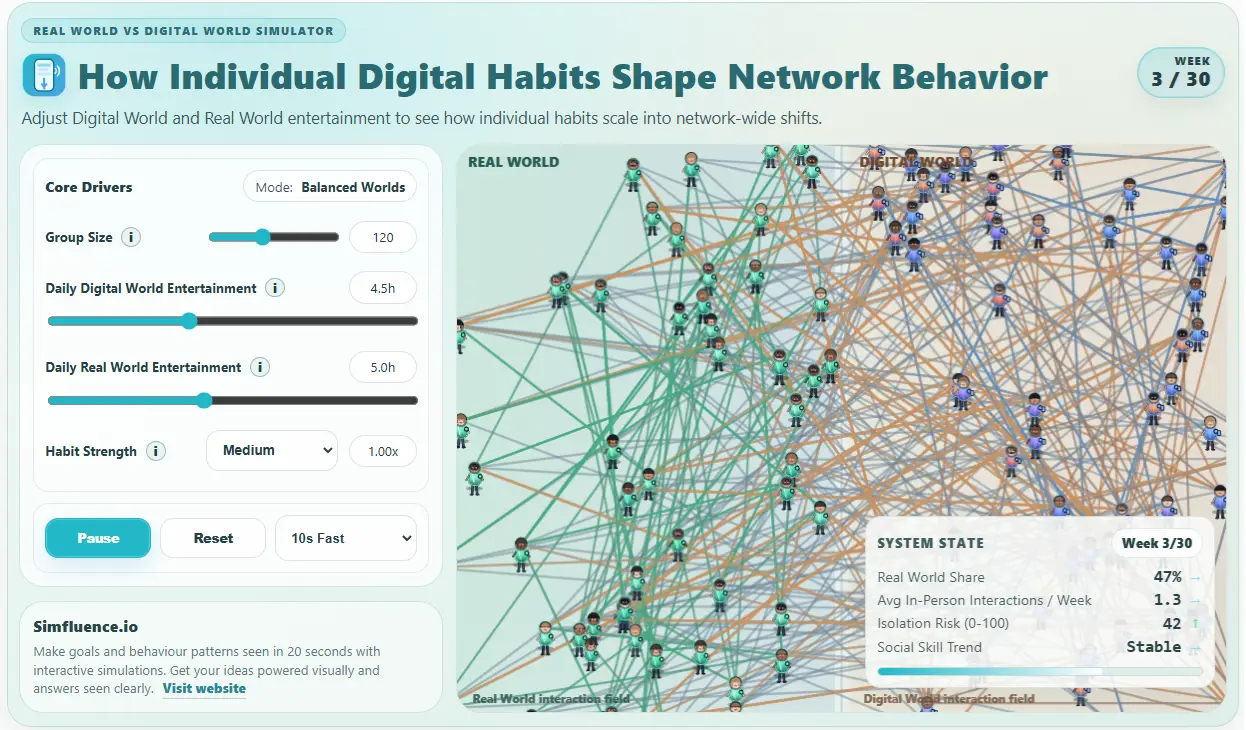
How individual digital habits shape network behavior. Adjust Digital World and Real World entertainment to see how individual habits scale into network-wide shifts — fast enough to feel in ~10 seconds.